|
 |
 |
|
 |
|
|
|
|
|
|
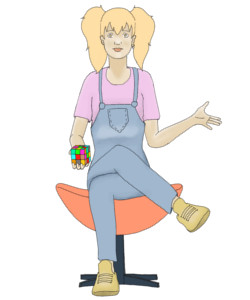
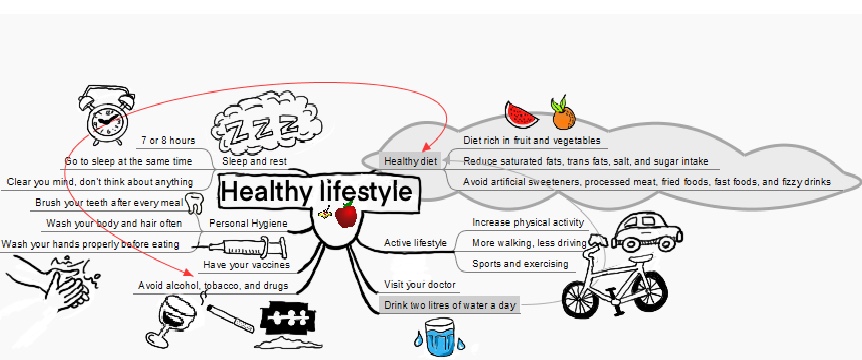
A diagram is a visual representation of systems, structures, and relationships using graphs, charts, drawings, maps, sketches or schemas. It is a simple data visualization or graphical representation tool that shows the different parts or components of something and how they work and interact with each other.
A diagram can be worth a thousand words. They have become an indispensable tool for teaching. They facilitate meaningful and effective learning.
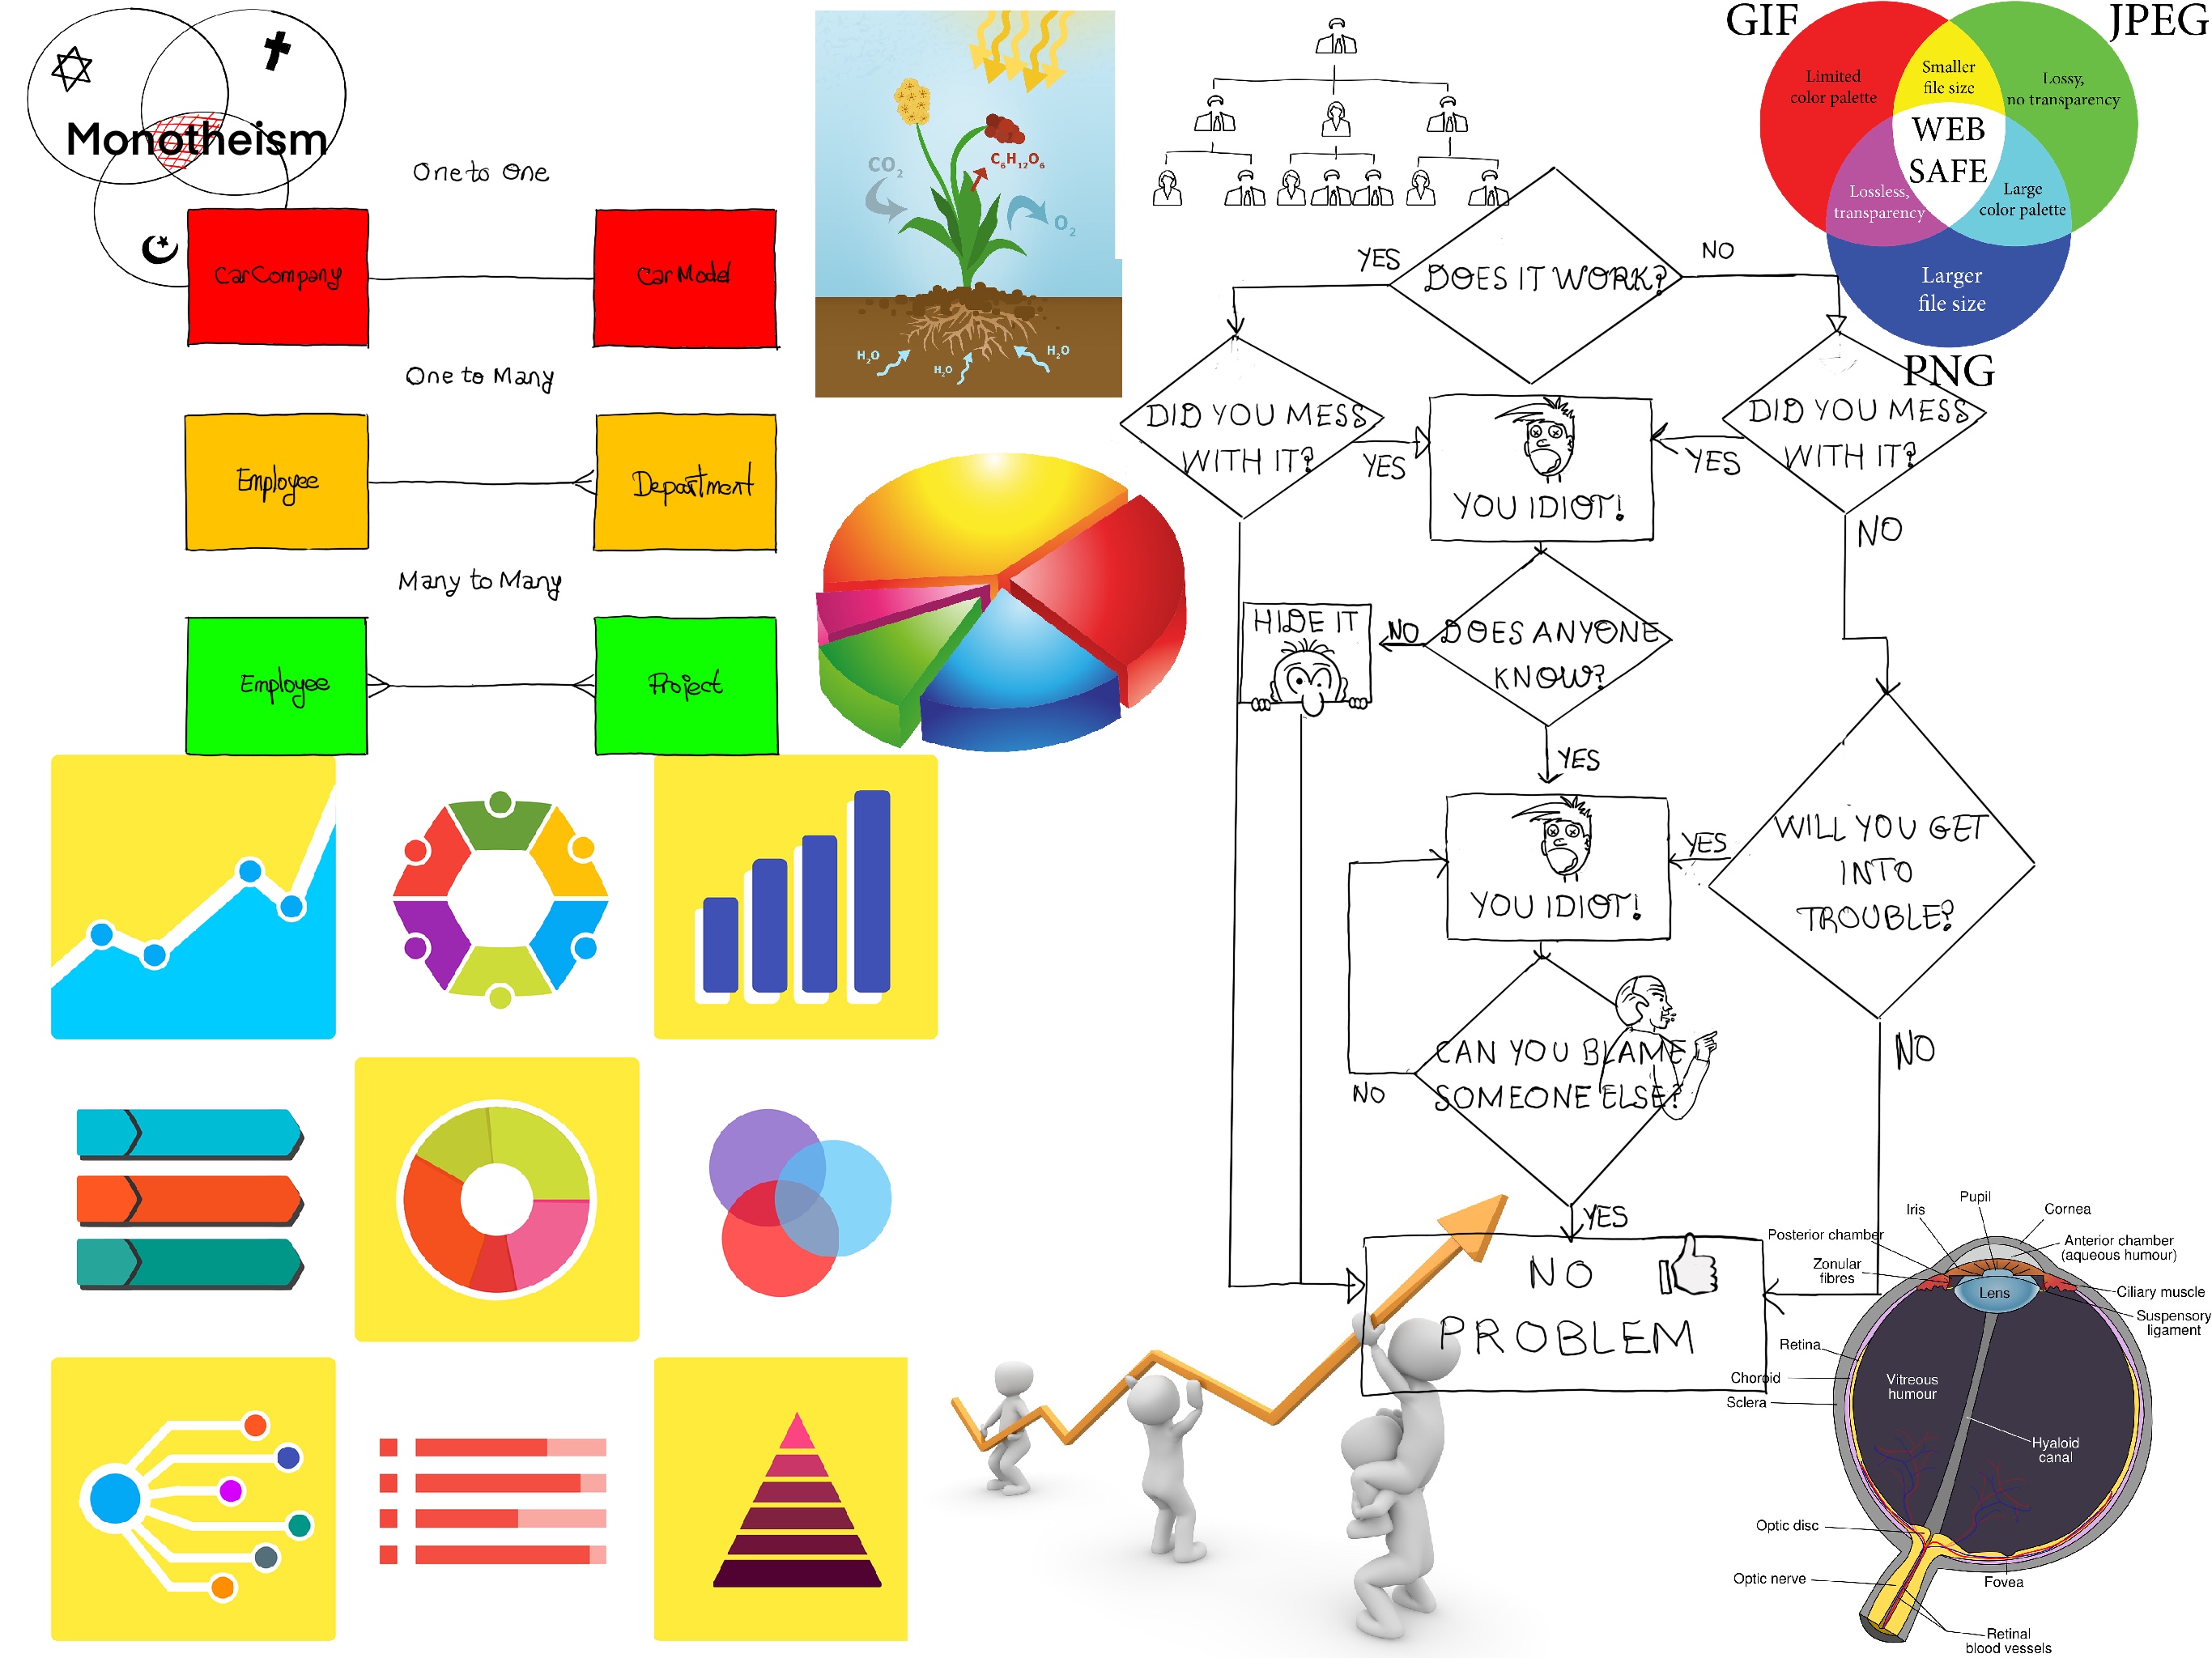
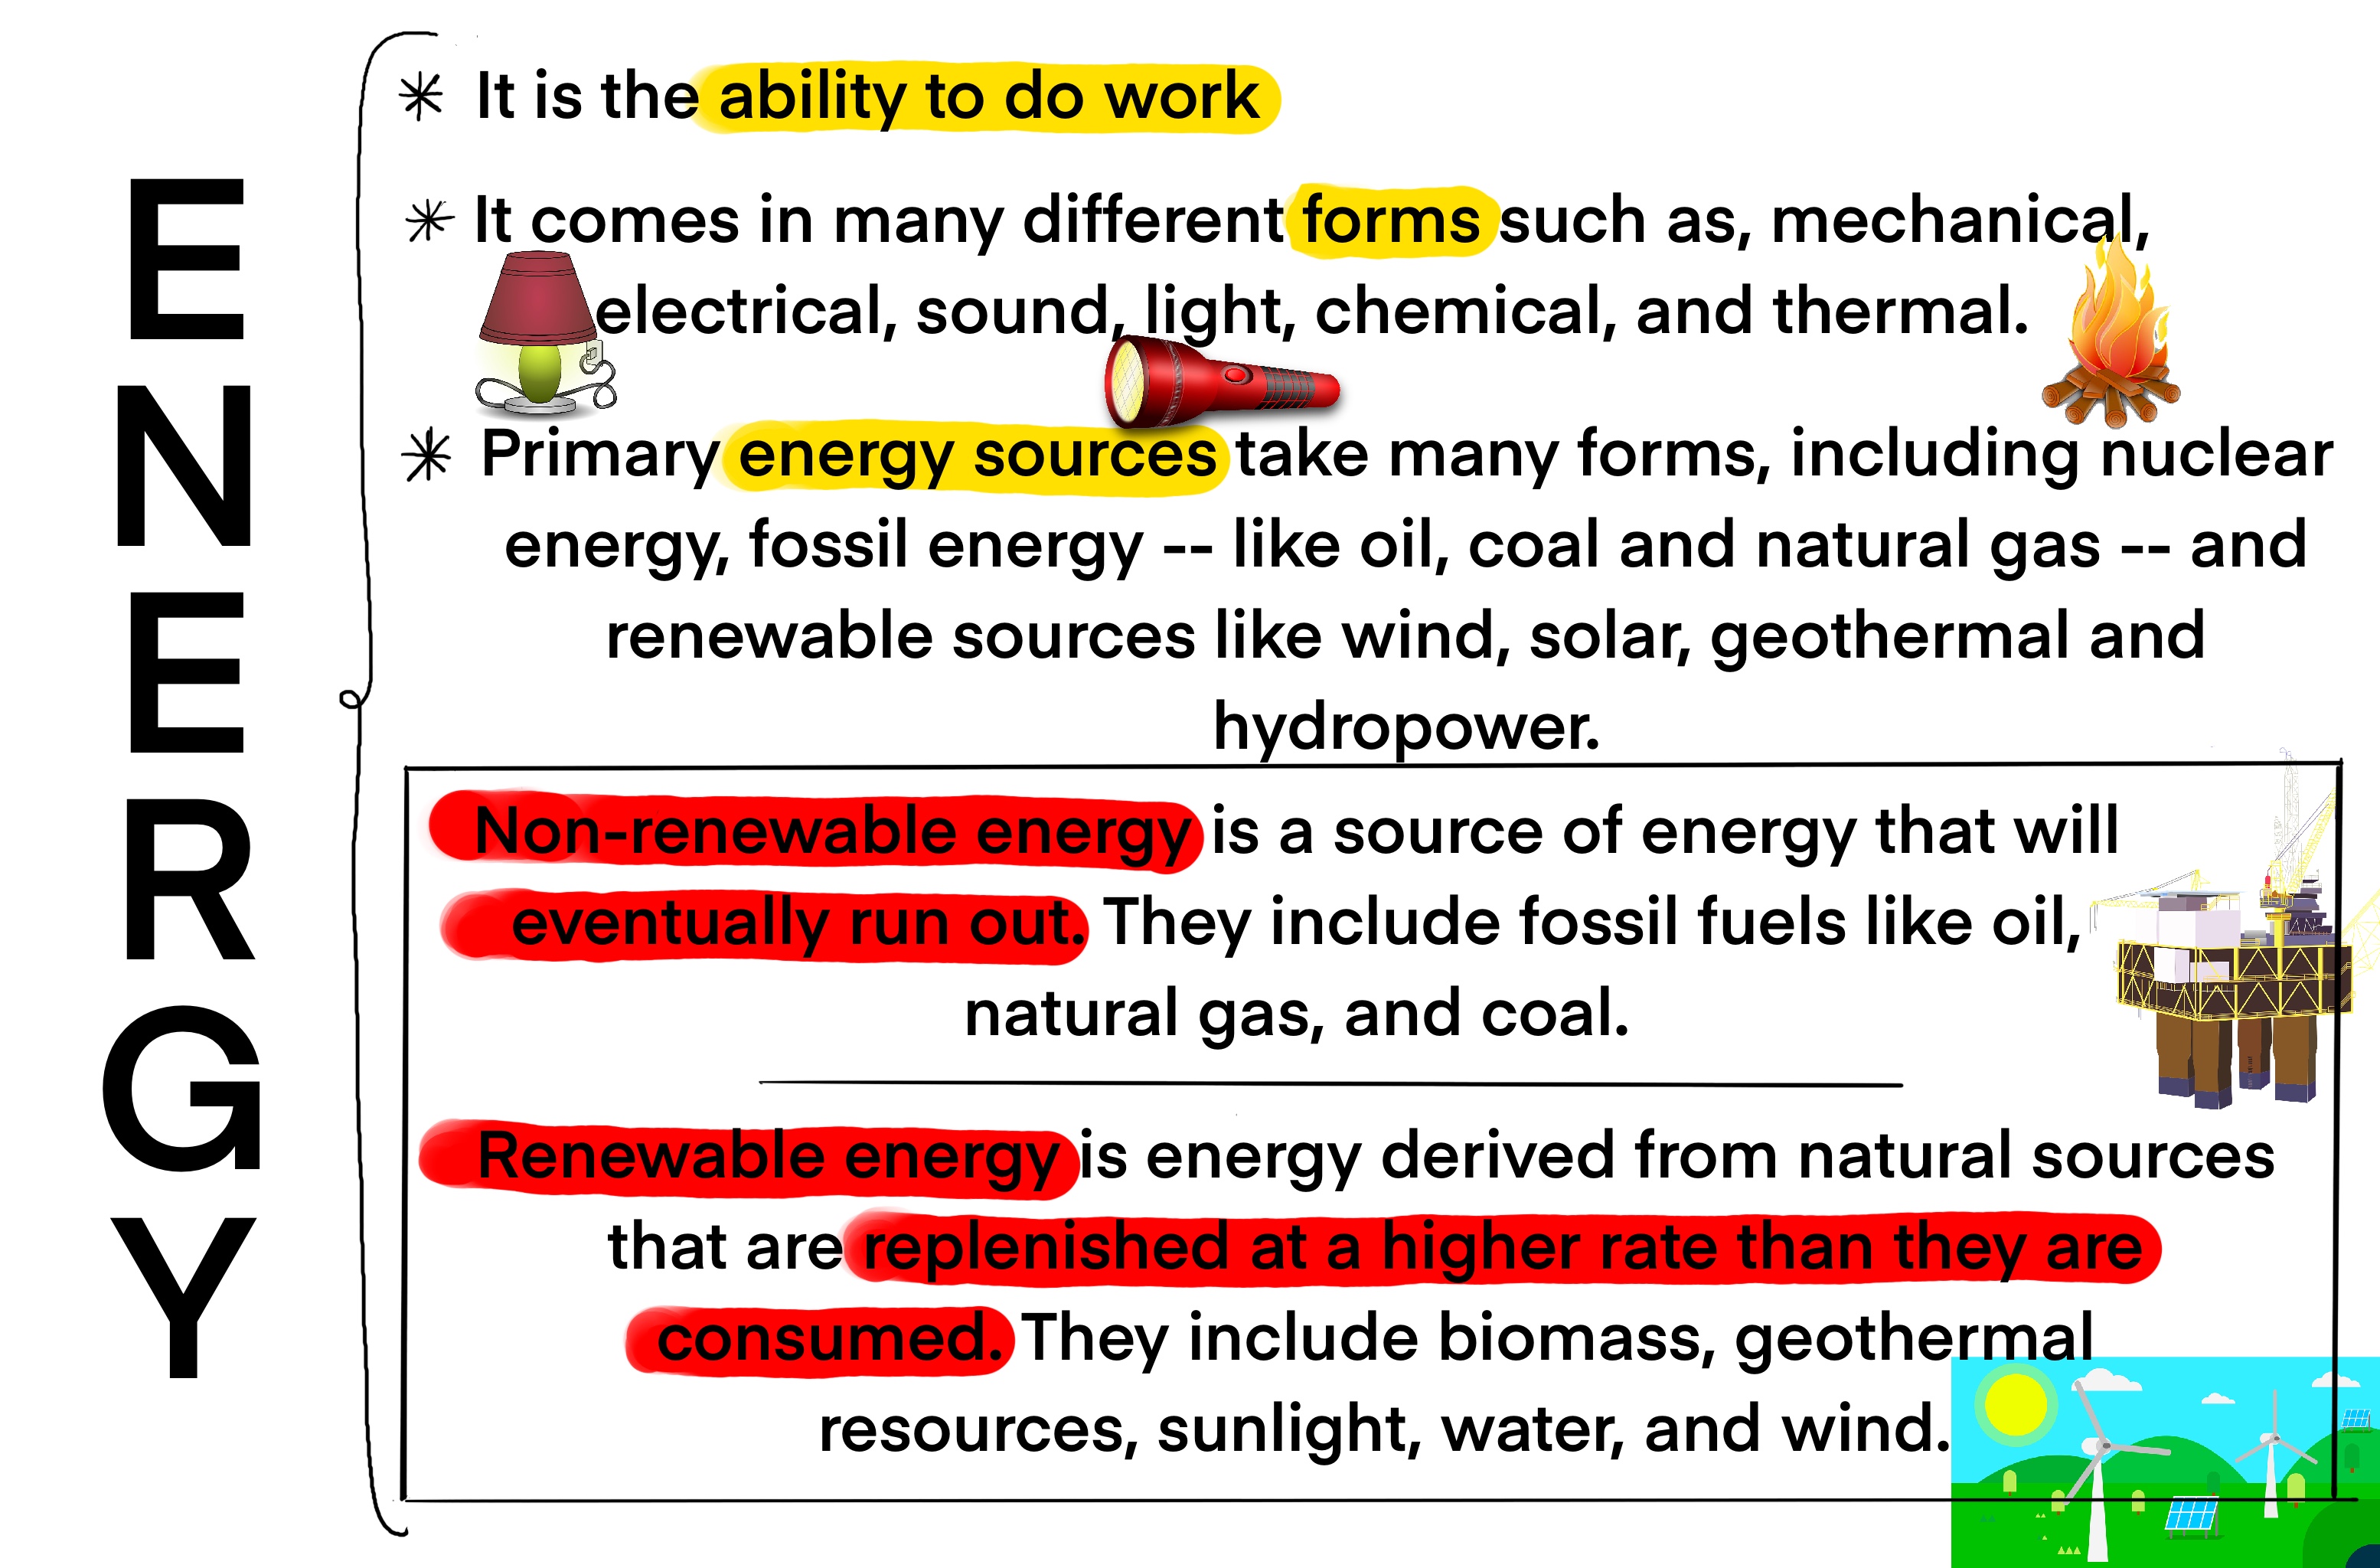 There are many types of diagrams, such as flowcharts, circuits, E-R diagrams, UML diagrams, network diagrams, etc. and many ways to draw them.
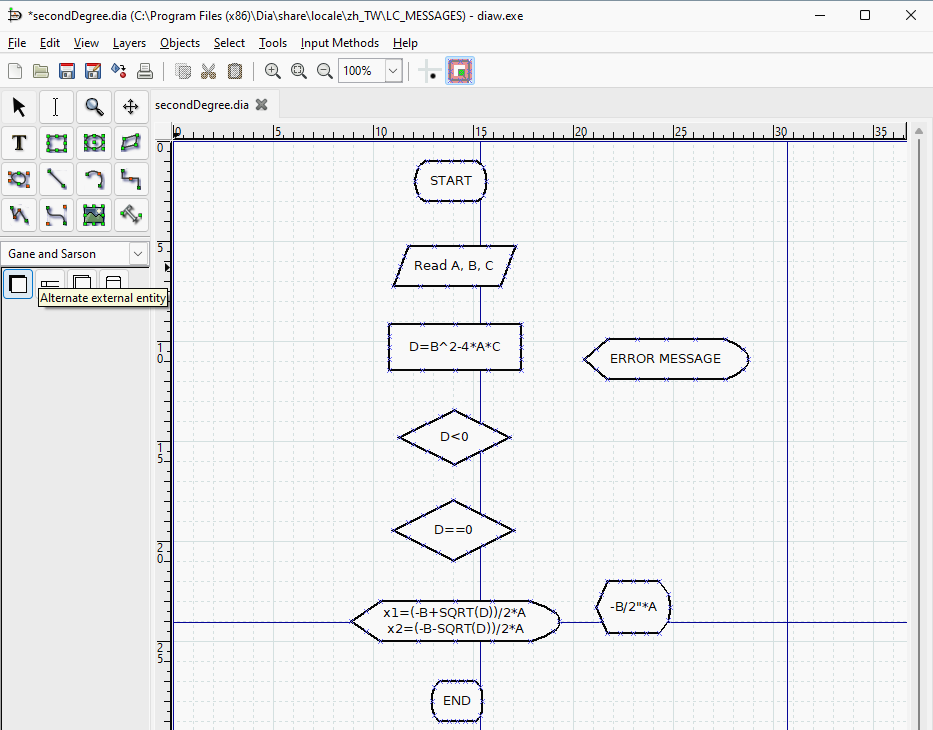
Dia is a free general-purpose diagramming software. It is a multiplatform application that supports more than 30 different types, such as flow charts, network diagrams, database models, UML, etc. It is a free alternative to Microsoft’s Visio.
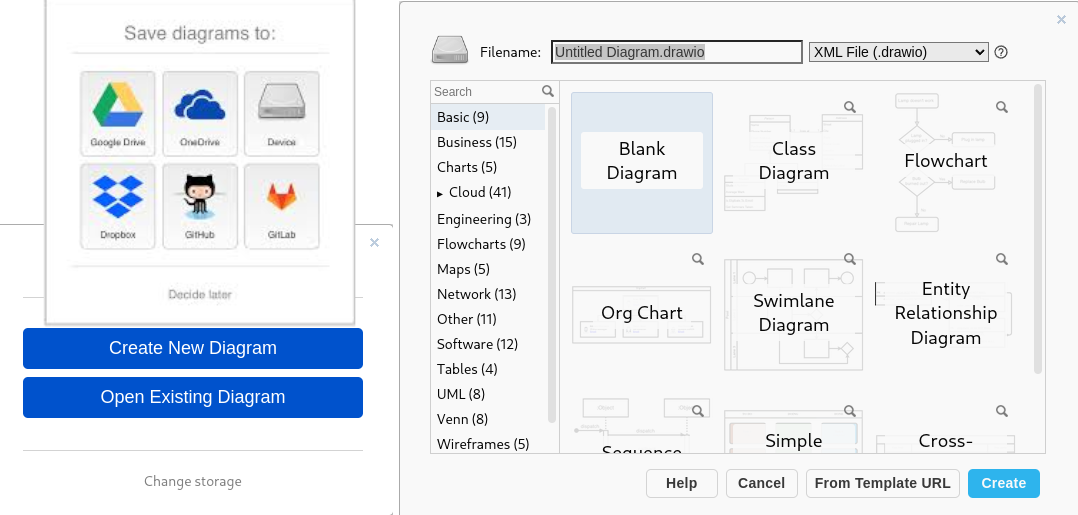
diagrams.net is a free online diagram tool for making flowcharts, process diagrams, organization charts, UML, ER and network diagrams, among others.
Open your favorite browser, go to diagrams.net, and select the location where you want to store your diagrams, e.g., Google Drive, OneDrive, Dropbox, etc.
If you have selected a cloud storage platform like Google Drive, OneDrive or Dropbox, then you need to authorize diagrams.net in your Google Drive, OneDrive or Dropbox account respectively.
Click Create New Diagram to start creating a new diagram in the diagram.net editor.
Select a category (e.g., Basic, Network, Software, UML, Venn, etc.), choose a template from which you would like to create a new diagram (e.g., Class Diagram, Flowchart, Entity Relationship Diagram, etc.), then smash the Create button.
An Entity Relationship Diagram, also know as an ERD or an ER diagram, is a specialized graphic or diagram that represents relationships among entities in a database. There are three basic concepts: entities, attributes, and relationships.
Add, edit, and replace shapes and connectors using the Shape library. Observe that the relationship between Employee and Department is 0:Many and between Employee and Project is many-to-many.
This is because a project can be worked on by many employees and an employee can work on many projects, so we introduce a junction table (EmployerProject) into the model. We will set the EmployerProject’s primary key to include all the primary keys from the other two tables (employeeId, projectId) and define two one-to-many relationships between the two original tables (Employee and Project) and the new junction table (EmployeeProject). The junction table is at the “many” side of both relationships. 
Click on the plus + symbol to add a new page to your diagram. Besides, you can save your diagram as an image or a SVG file (Export as, PNG…/JPEG…/SVG…) or you can embed your diagram into your web page (Export as…, HTML).

JustToThePoint Copyright © 2011 - 2024 Anawim. ALL RIGHTS RESERVED. Bilingual e-books, articles, and videos to help your child and your entire family succeed, develop a healthy lifestyle, and have a lot of fun. Social Issues, Join us.
This website uses cookies to improve your navigation experience.
By continuing, you are consenting to our use of cookies, in accordance with our Cookies Policy and Website Terms and Conditions of use.