
|
 |

|
|
|
|
|
|
Truth is not what you want it to be; it is what it is. And you must bend to its power or live a lie, Miyamoto Musashi.
The truth is multifaceted and complex. Life is always messier than our dreams and beliefs, reality is more complicated that we think it is, it is constantly changing like the wind and the future is not promised, but completely unpredictable, Anawim, #justtothepoint.
Definition. A function f is a rule, relationship, or correspondence that assigns to each element of one set (x ∈ D), called the domain, exactly one element of a second set, called the range (y ∈ E).
The pair $(x, y)$ is denoted as $y = f(x)$. In this notation, $x$ is the independent variable (input), and $y$ is the dependent variable (output). Typically in introductory calculus, the sets $D$ (domain) and $E$ (range) are subsets of the real numbers, $\mathbb{R}$.
Graphing functions involves the visual representation of a curve that reflects the behavior of a mathematical function on a coordinate plane, also known as the Cartesian plane. It is a two-dimensional space defined by two perpendicular axes: the horizontal x-axis and the vertical y-axis.
A systematic approach to graphing a function begins by constructing a table containing selected input values and their corresponding output values. By extending this table, we can plot the points on the coordinate plane and observe the pattern they form. Connecting these points reveals the shape of the curve, allowing us to gain insights into the behavior of the function across its domain. This process provides a visual means of understanding the relationships between different variables and aids in interpreting the overall characteristics of the function, such as rates of change and limits.
When sketching the graph of a function without relying heavily on point-plotting, follow this systematic, 7-step calculus approach:
Sometimes it is easiest to draw a simple “parent” graph and then apply geometric transformations. Given a parent function $f(x)$, we can alter it to $y = a \cdot f(b(x - h)) + k$.
Translations (Shifting). A translation of a function is a shift in one or more directions. It is a transformation that moves the function’s graph horizontally or vertically without changing its shape or orientation.
$\star$ Vertical Shift: $f(x) + k$ shifts the graph vertically by $k$ units (up if $k>0$, down if $k<0$).
$\star$ Horizontal Shift: $f(x - h)$ shifts the graph horizontally by $h$ units (right if $h>0$, left if $h<0$).
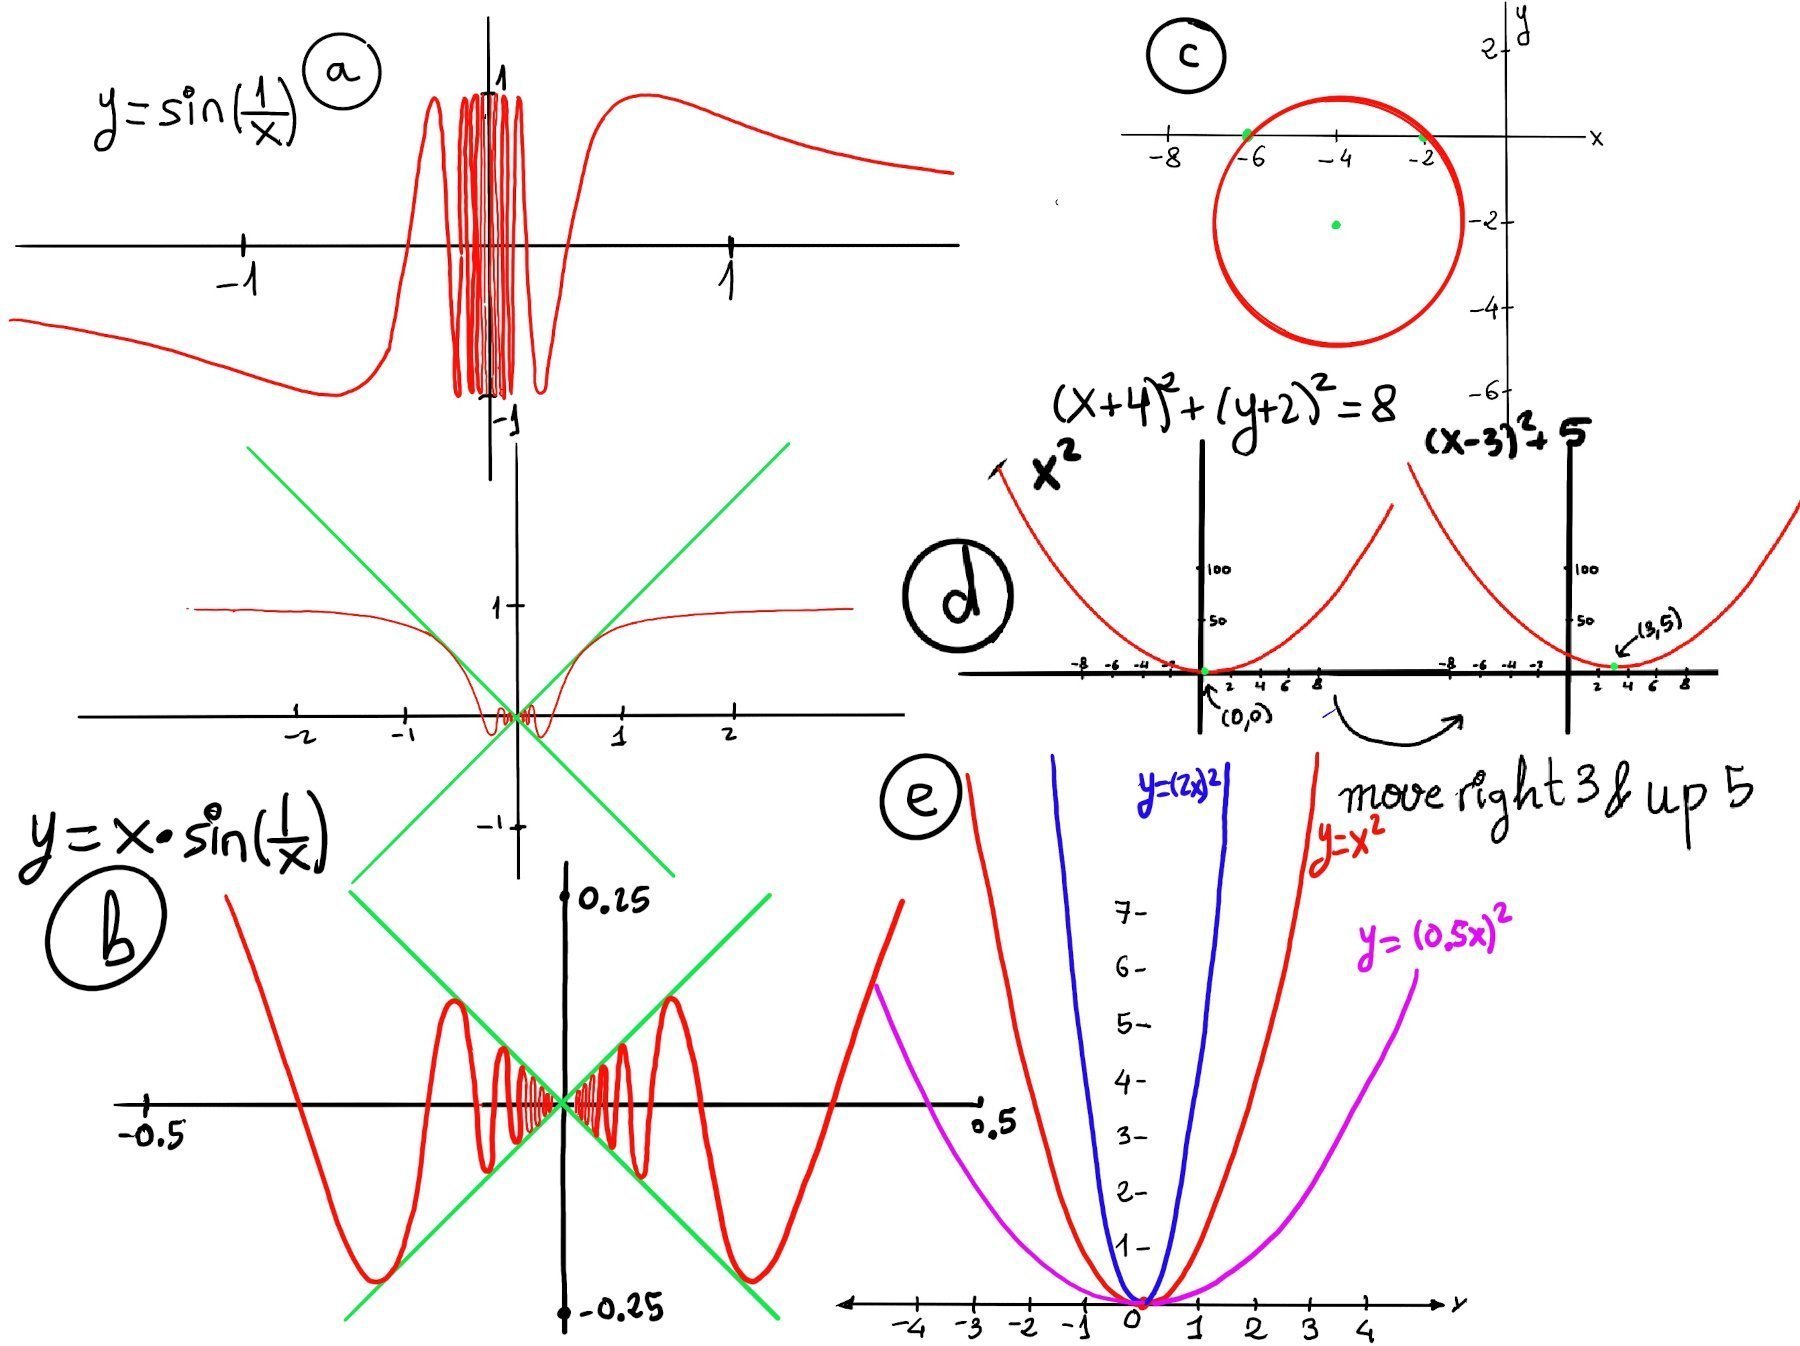
$\star$ Example: $y = (x - 3)^2 + 5$ (Figure d) moves the parent function $x^2$ three units to the right and five units up.
Dilations and Compressions (Scaling). Scaling stretches or squeezes the graph.
$\star$ Horizontal Scaling: f(bx) where |b| > 1 squeezes or compresses the graph toward the y-axis. For example, $y = \cos(2x)$ (Figure 1) oscillates twice as fast as $\cos(x)$. Conversely, f(bx) where $0 < |b| < 1$ dilates the graph away from the y-axis, stretching it horizontally, e.g., $y = (0.5x)^2$ (Figure e).
$\star$ Vertical Scaling: $a \cdot f(x)$ stretches the graph vertically if $|a| > 1$ and compresses it vertically if $0 < |a| < 1$.
Reflections (Flipping). A reflection is a transformation where a curve is flipped across a line of reflection.
$\star$ x-axis reflection: $-f(x)$ flips the graph upside down. Example: $f(x) = x^2 - 3 \implies -f(x) = -x^2 + 3$ is a reflection in the y-axis (Figure 2).
$\star$ y-axis reflection: $f(-x)$ flips the graph left-to-right. Example: $f(x) = \sqrt{x}$ has a domain of $x \ge 0$. Its reflection, $g(x) = \sqrt{-x}$, has a domain of $x \le 0, Domain(g) = \mathbb{R}^+$ (Figure 3).
Combining transformations: The function $y = 4(x - 2)^2 + 3$ takes the parent $x^2$, stretches it vertically by a factor of 4, translates it right by 2, and translates it up by 3.

Piecewise functions are functions that behave differently based on the input ($x$) value. They define different mathematical expressions for different intervals of their domain. Graphing them involves plotting the respective “pieces” strictly within their defined bounds.
To evaluate limits and continuity at the “break points”, we must check the left-hand and right-hand limits.

Notice that $\frac{|x|}{x}$ is undefined at $x = 0$. $\lim_{x \to 0^-} \frac{-x}{x} = -1$, while $\lim_{x \to 0^+} \frac{x}{x} = 1$. The limit does not exist, creating a split graph (figure iii).
Figure iv, v, and vi are the corresponding plots of $f(x)=\sqrt{x}$, Domain(f) = ℝ⁺, $f(x) = \begin{cases} x^2, &x < 2 \\\\ 2x, &x ≥ 2 \end{cases}$, and the greatest integer function ⌊x⌋ respectively.
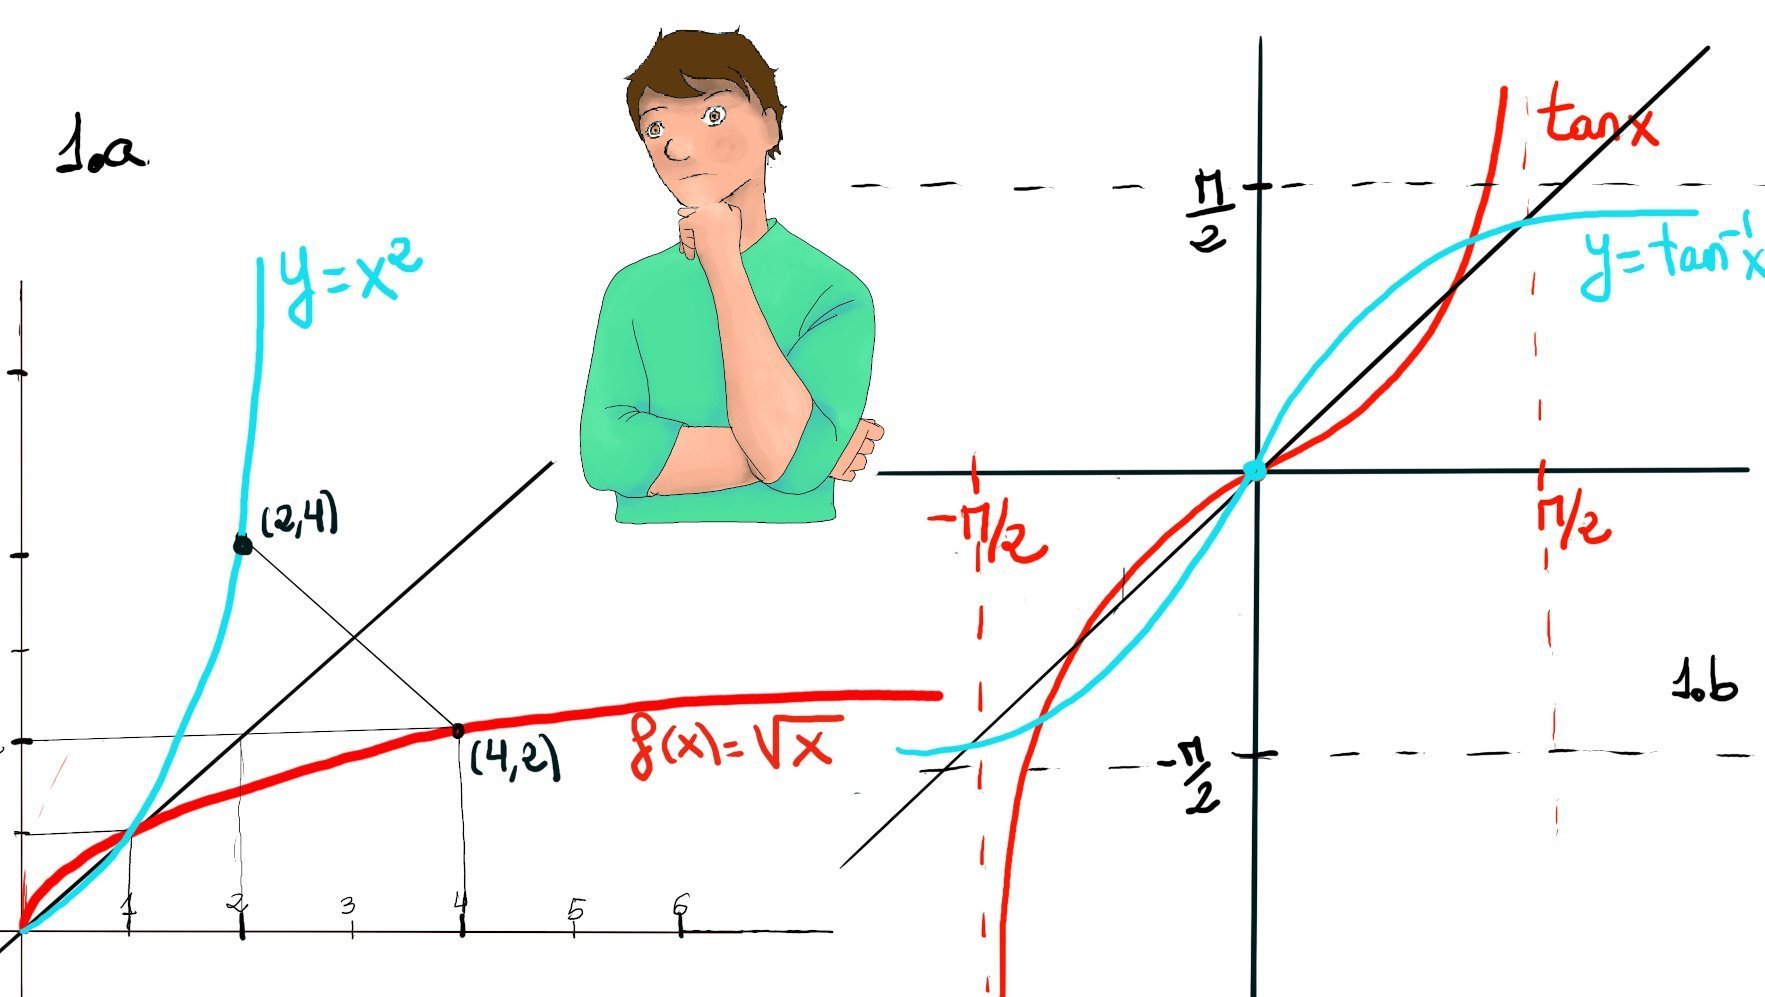
Loosely speaking, the inverse function of a function f is a function that undoes the operation of the original function. If $f$ maps an element $x$ in its domain to a unique element $y$ in its range, then the inverse function, denoted as $f^{-1}$, maps $y$ back to $x$.
For a given function $f$, its inverse $f^{-1}$ reverses the input and output: $f^{-1}(f(x)) = x$. Note that $f^{-1}$ is not an exponent; $f^{-1}(x) \neq \frac{1}{f(x)}$.
The Horizontal Line Test and Restrictions: For an inverse function to exist, the original function must be both one-to-one (injective) and onto (surjective).
A function is one-to-one if each element of the domain maps to a distinct (unique) element in the codomain or range (meaning it passes the Horizontal Line Test —no horizontal line crosses the graph more than once), and it is onto if every element in the codomain is mapped to by at least one element in the domain or, in other words, has a pre-image in the domain.
If a function is not one-to-one (like $y = x^2$, which is a U-shape), we must restrict its domain (e.g., $x \ge 0$) to find an inverse.
Graphical Relationship: If you want to plot the graph of $f^{-1}$, you just simply reflect the graph of $f(x)$ across the diagonal line $y = x$. This is because finding an inverse algebraically involves swapping the $x$ and $y$ variables.
Common Inverse Pairs:
Algebraic Examples:

$\frac{x^{2}}{1-x^{2}}$
The plot is shown in Figure 1.d.
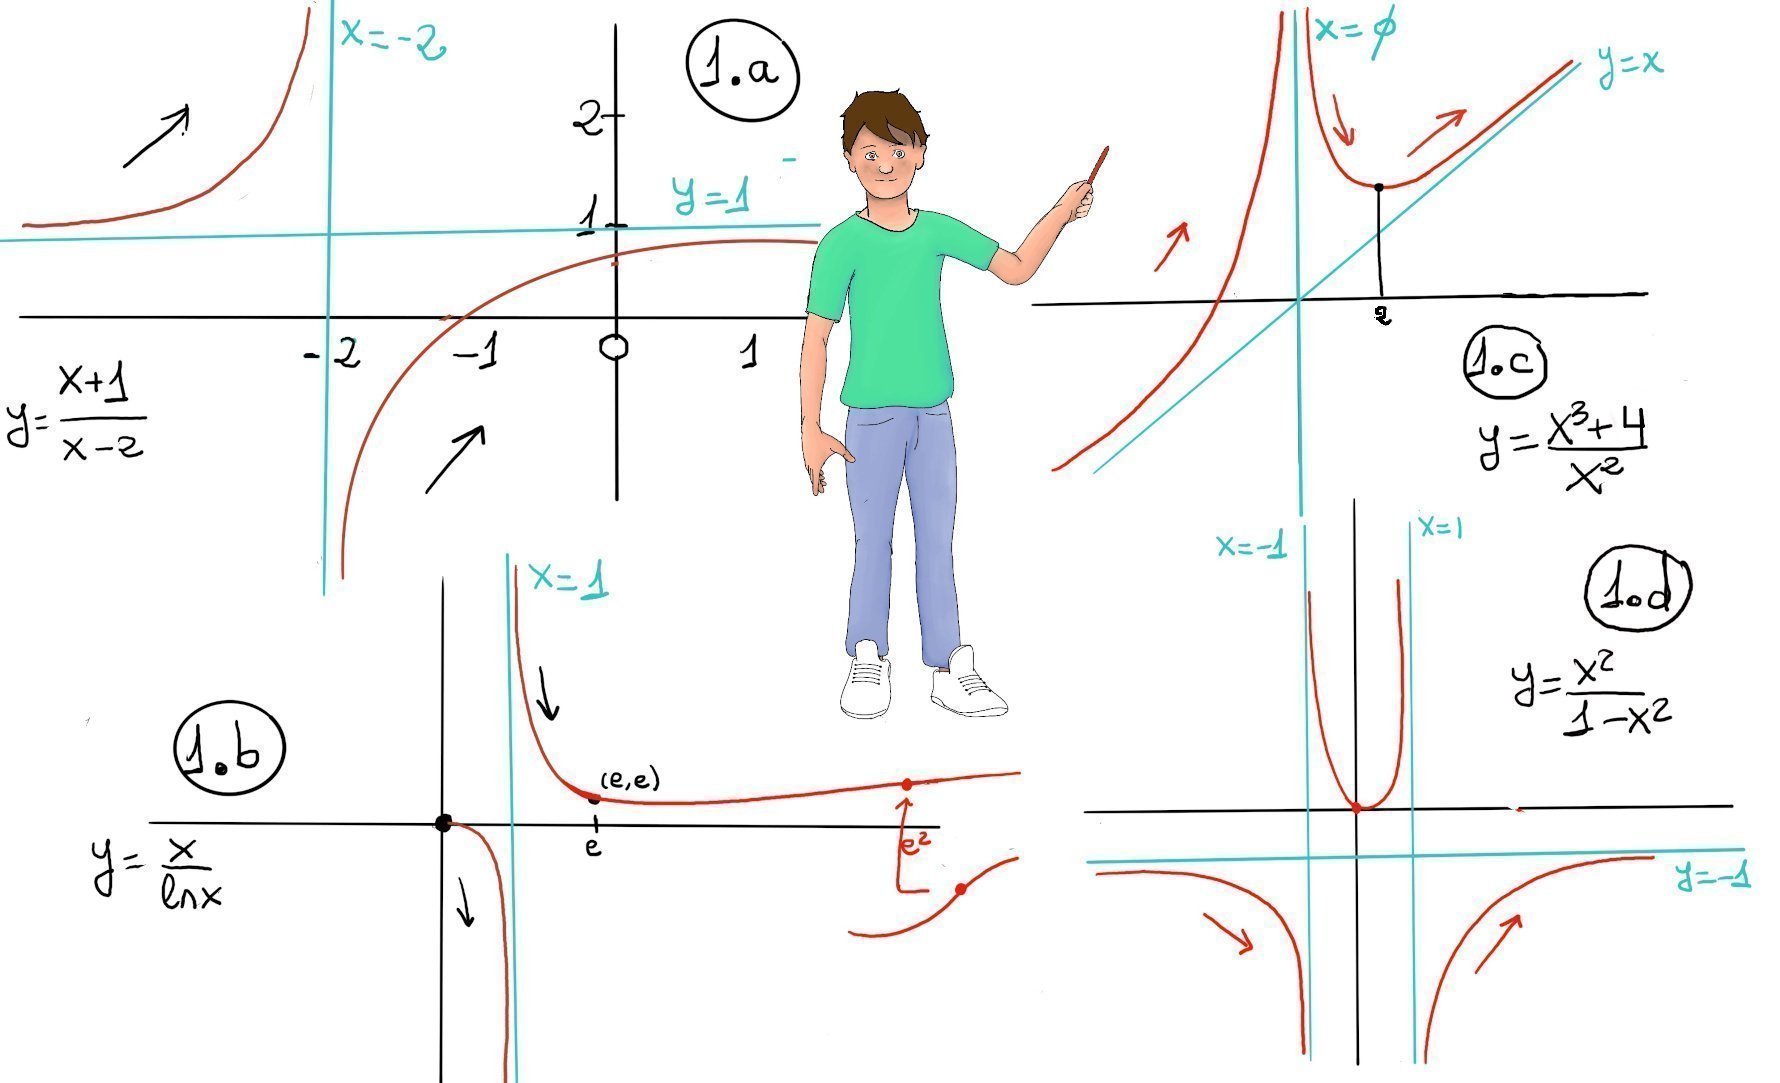
The plot is shown in Figure 1.b.
The sine function is the ratio of the length opposite to the given angle and the hypotenuse of the given triangle, $\sin(\theta) = \frac{\text{opposite}}{\text{hypotenuse}}$. It is an odd function ($\sin(-x) = -\sin(x)$), periodic with a period of $2\pi$, and strictly bounded between $-1$ and $1$.
For $f(x) = \sin(1/x)$, it is essential to notice that $|\sin(1/x)| \le 1$, hence the entire graph is bounded between the horizontal lines $y = -1$ and $y = 1$.


(Figure b).
Recall our boundary for the sine function: $\left| \sin\left(\frac{1}{x}\right) \right| \le 1 \iff -1 \le \sin\left(\frac{1}{x}\right) \le 1$
If we multiply the entire inequality by $x$ (assuming $x > 0$ for a moment), we get: $-x \le x\cdot\sin\left(\frac{1}{x}\right) \le x$
This means the graph is “squeezed” or bounded between the linear lines $y = x$ and $y = -x$. Because both of these boundary lines approach $0$ as $x \to 0$, we can apply the Squeeze Theorem: $\boxed{\lim_{x \to 0} x \cdot \sin\left(\frac{1}{x}\right) = 0}$
Near $x = 0$, both the sinusoidal and reciprocal properties cause rapid oscillations, but those oscillations are strictly clamped down to the origin by the envelope of $y = x$ and $y = -x$.
End behavior at infinity: As $x \to \infty$, we can rewrite the expression to use L’Hôpital’s rule (or the standard limit $\lim_{u\to 0} \frac{\sin u}{u} = 1$ where $u = 1/x$):
$$\lim_{x \to \infty} x \cdot \sin\left(\frac{1}{x}\right) = \lim_{x \to \infty} \frac{\sin(1/x)}{1/x} = \lim_{x \to \infty} \frac{\cos(1/x) \cdot (-1/x^2)}{(-1/x^2)} = \lim_{x \to \infty} \cos(1/x) = \cos(0) = 1$$So moving away from the origin, the function will touch its boundary envelopes $y = \pm x$ for the last time near $x = \pm 1$, and then gradually approach a horizontal asymptote of $y = 1$.

JustToThePoint Copyright © 2011 - 2026 Anawim. ALL RIGHTS RESERVED. Bilingual e-books, articles, and videos to help your child and your entire family succeed, develop a healthy lifestyle, and have a lot of fun. Social Issues, Join us.
This website uses cookies to improve your navigation experience.
By continuing, you are consenting to our
use of cookies, in accordance with our Cookies Policy and
Website Terms and Conditions of use.