
|
 |

|
|
|
|
|
|
A smile is a curve that sets everything straight, Phyllis Diller.
Definition: A function $f$ is a rule, relationship, or correspondence that assigns to each element of one set ($x \in D$), called the domain, exactly one element of a second set ($y \in E$), called the range.
The pair $(x, y)$ is denoted as $y = f(x)$. Typically, in introductory calculus, both $D$ and $E$ are subsets of the set of real numbers, $\mathbb{R}$.
Graphing functions involves creating a visual representation of a curve that reflects the behavior of a mathematical function on a coordinate plane, also known as the Cartesian plane. This is a two-dimensional space defined by two perpendicular axes: the horizontal x-axis and the vertical y-axis.
A systematic approach to graphing a function begins by constructing a table containing selected input values and their corresponding output values. By extending this table, we can plot the points on the coordinate plane and observe the pattern they form. Connecting these points reveals the shape of the curve, allowing us to gain insights into the behavior of the function across its domain.
Linear functions are the simplest to graph because their visual representation is just a straight line. Here, $m$ represents the slope (steepness), and $b$ represents the y-intercept.
To plot a linear function, you only need to find two points (choose two points that are relatively easy to calculate). The easiest points to calculate are usually the intercepts:
x-intercept: The point where the graph crosses the x-axis. It occurs when $y = 0$. By solving $0 = mx + b$, we find the x-intercept is $\frac{-b}{m}$.
y-intercept: The point where the graph crosses the y-axis. It occurs when $x = 0$. By substituting zero, we find the y-intercept is simply $b$.
Examples:
$y = 2x - 6$: The y-intercept is $(0, -6)$. The x-intercept is $\frac{6}{2} = 3$, so $(3, 0)$.
$y = -2x + 5$: The y-intercept is $(0, 5)$. The x-intercept is $\frac{-5}{-2} = 2.5$, so $(2.5, 0)$ (Figure iii).
If the equation of a graph is y = -2x + 5, to find the y-intercept, set $x = 0 \implies y = -2(0) + 5 \implies y = 5$. Therefore, the y-intercept is (0, 5). In other words, when the equation of a line is written in a slope-intercept form ($y = mx + b$), the y -intercept can be read immediately from the equation, that is, b, e.g., $y = -2x + 5$ the y-intercept is (0, 5) (Figure iii).
A linear function is a function of the form $y = mx + b$, where m is the slope of the line, b is the y-intercept, and $\frac{-b}{m}$ the x-intercept.
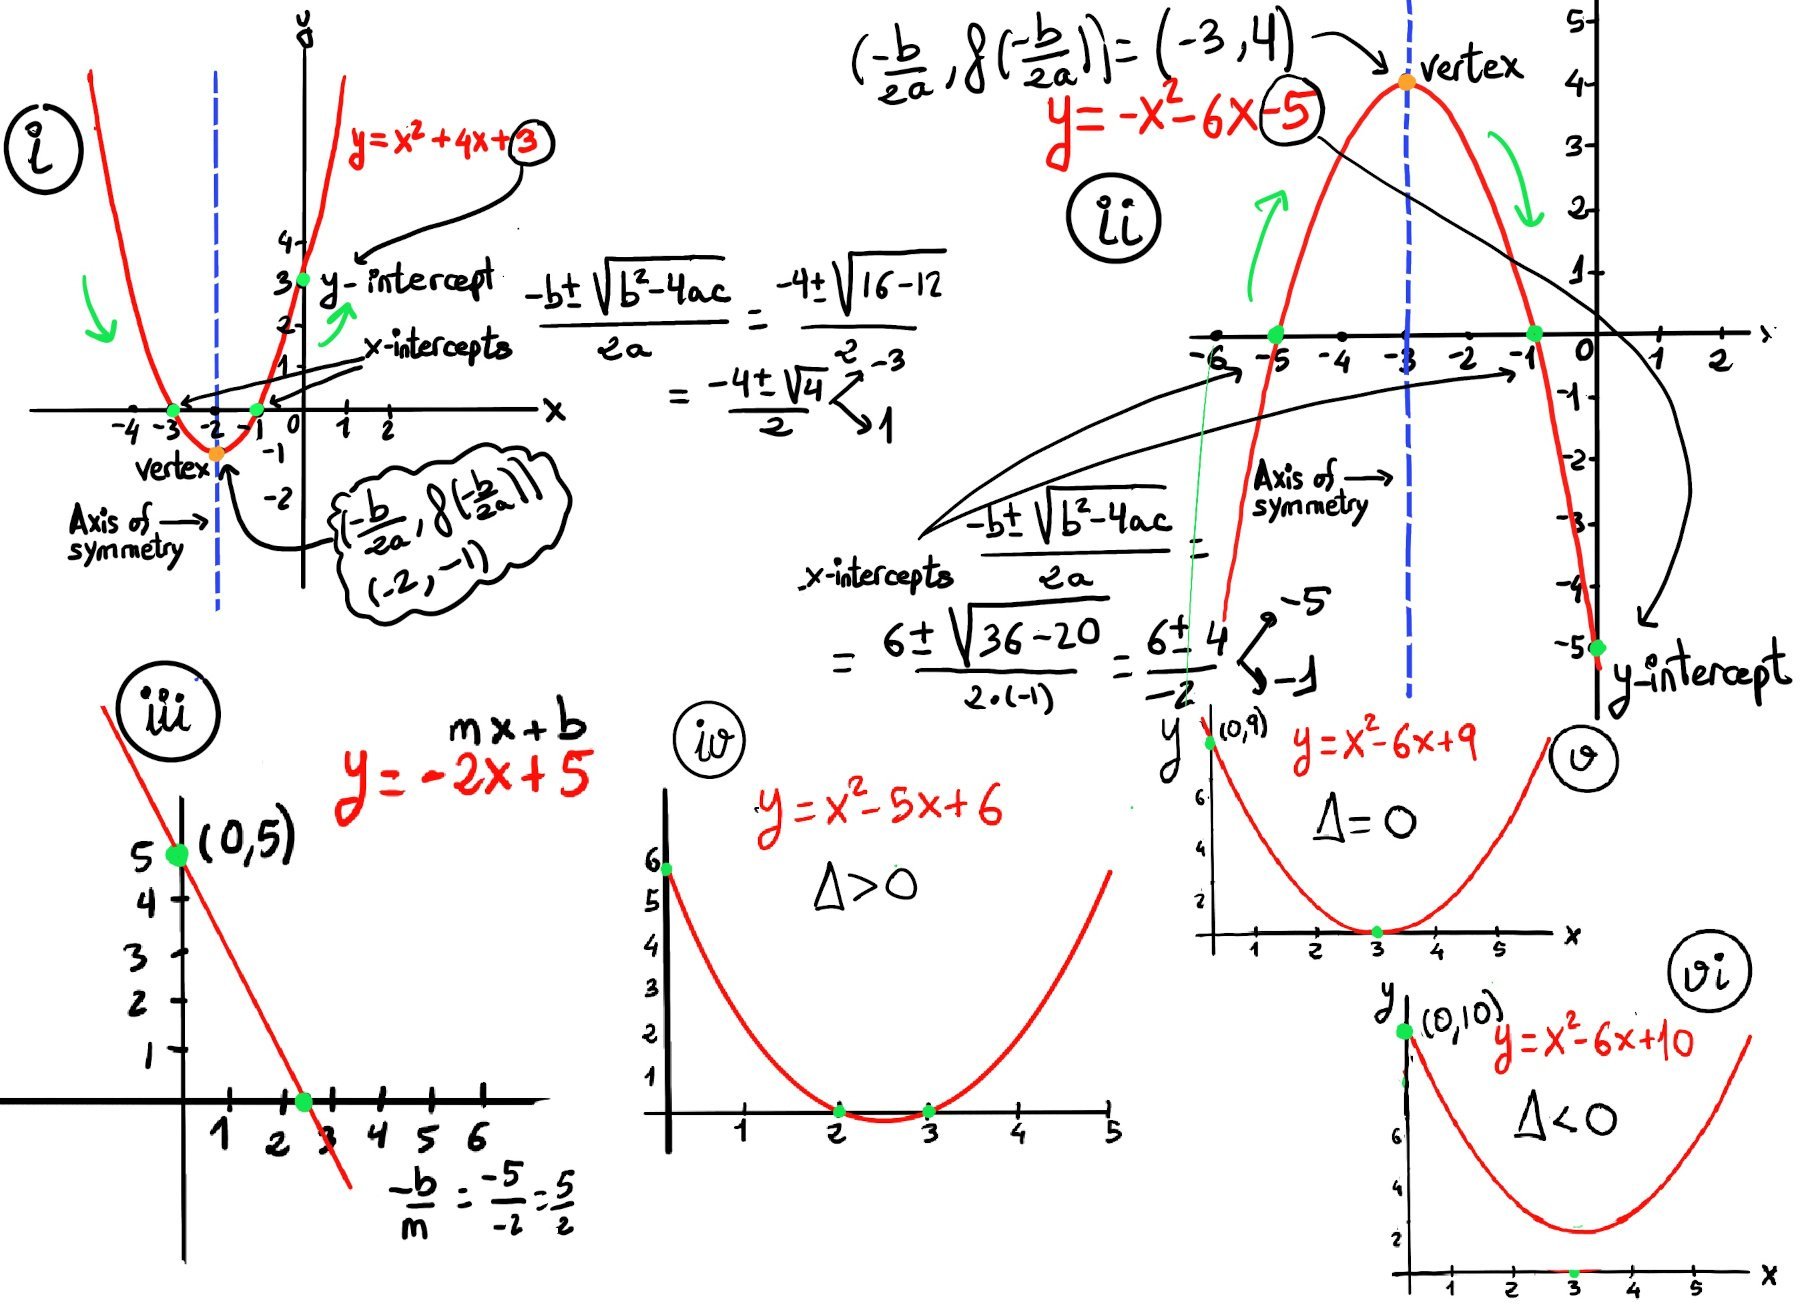
The graph of a quadratic function is a U-shaped curve called a parabola. It features a turning point called the vertex where the curve changes direction.
If $a > 0$, the parabola opens upwards, and the vertex is the absolute minimum. In other words, it represents the lowest point on the curve and its y-coordinate is the minimum value of the quadratic function.
If $a < 0$, the parabola opens downwards, and the vertex is the absolute maximum, i.e., it represents the highest point on the curve, and its y-coordinate is the maximum value.
In either case, the vertex is a turning point on the graph.
The graph is perfectly symmetric with a vertical line drawn through the vertex, called the axis of symmetry, defined by the equation $x = \frac{-b}{2a}$, So, the graph of the function is increasing on one side of the axis and decreasing on the other side.
In a quadratic function, we use the quadratic formula, x = $\frac{-b±\sqrt{b^2-4ac}}{2a}$, for the x-intercepts and represent the roots or zeros of the quadratic function. The discriminant can be used to calculate the number of x-intercepts and the type of solutions of the quadratic equation.
If the value of the discriminant, $b^2-4ac$, is less than zero, the quadratic equation has two imaginary solutions meaning that the equation does not have any real solution or there are no x-intercepts, i.e., the parabola never touches the x-axis, e.g., y = $x^2-6x+10, b^2-4ac = 36-40 = -4 < 0,$ (Figure vi).
If the value of the discriminant equals zero, then the quadratic equation has a repeated real root meaning the graph of the solution has a single x-intercept, i.e., the vertex rests exactly on the x-axis, e.g., $x^2-6x+9, b^2-4ac = 36-36 = 0, x = \frac{-b±\sqrt{b^2-4ac}}{2a} = \frac{6±\sqrt{0}}{2} = 3,$ (Figure v)
If the value of the discriminant is positive, then the quadratic equation has two real roots meaning the graph of the solution has two distinct intersect. The parabola crosses the x-axis twice, e.g., $x^2-5x+6, b^2-4ac = 25-24 = 0, x = \frac{-b±\sqrt{b^2-4ac}}{2a} = \frac{5±\sqrt{1}}{2}=$ 3 or 2(Figure iv).
Using derivatives allows us to sketch complex curves without plotting dozens of points. Let’s analyze $f(x) = 3x - x^3$:
End Behavior (Limits): $\lim_{x \to \infty} (3x - x^3) = -\infty$ and $\lim_{x \to -\infty} (3x - x^3) = \infty$
First Derivative (Critical Points): $f'(x) = 3 - 3x^2 = 3(1 - x)(1 + x)$. Setting $f'(x) = 0$ gives critical points at $x = 1$ and $x = -1$.
Second Derivative (Concavity & Extrema): $f''(x) = -6x$. Setting $f''(x) = 0$ reveals an inflection point at $x = 0$.
$\star$ $f''(1) = -6$ (Negative $\implies$ Concave down $\implies$ $x = 1$ is a local maximum).
$\star$ $f''(-1) = 6$ (Positive $\implies$ Concave up $\implies$ $x = -1$ is a local minimum).
Symmetry: $f(-x) = 3(-x) - (-x)^3 = -3x + x^3 = -(3x - x^3) = -f(x)$. Because $f(-x) = -f(x)$, this is an odd function, meaning it has rotational symmetry about the origin $(0,0)$.
Finally, let’s plot our critical points, namely f(1) = 2, f(-1) = -2, f(0) = 0 -Figure 1.e-.
Rational functions introduce asymptotes —invisible lines that the graph approaches but never quite touches.
First Derivative (Increasing/Decreasing):
Using the quotient rule, $f'(x) = \frac{1}{(x + 2)^2}$. Since $f'(x) > 0$ for all real numbers except $x = -2$, the function is strictly increasing on $(-\infty, -2) \cup (-2, \infty)$.
Critical points are those where the derivate is zero or the derivate is not defined, e.g., in our example, x = -2.
Vertical asymptotes are vertical lines (perpendicular to the x-axis) of the form x = a (where a is a constant) near which the function grows without bound.
The line x = a is a vertical asymptote if: $\lim_{x \to a^{-}}f(x)=\pm\infty$ or $\lim_{x \to a^{+}}f(x)=\pm\infty$, e.g., x = -2 is a vertical asymptote of $\frac{x+1}{x+2}$.
$\lim_{x \to -2^{+}}\frac{x+1}{x+2} = \frac{-1}{0+} = -\infty, \lim_{x \to -2^{-}}\frac{x+1}{x+2} = \frac{-1}{0-}= \infty$. Therefore, the line $x = -2$ is a vertical asymptote.
Horizontal Asymptotes:
Horizontal asymptotes are horizontal lines (parallel to the x-axis) that the graph of the function approaches as $x \to \pm \infty$.
$y = c$ is a horizontal asymptote if the function f(x) becomes arbitrarily close to c as long as x is sufficiently large or small or more formally: $\lim_{x \to \infty}f(x)=c$ or $\lim_{x \to -\infty}f(x)=c$
$\lim_{x \to \pm\infty} \frac{x+1}{x+2} = 1$. Therefore, the line $y = 1$ is a horizontal asymptote.
Second Derivative (Concavity):
$f''(x) = \frac{-2}{(x + 2)^3}$.
($\star$) For $x < -2$, $f''(x)$ is positive (concave upward).
($\star$) For $x > -2$, $f''(x)$ is negative (concave downward).
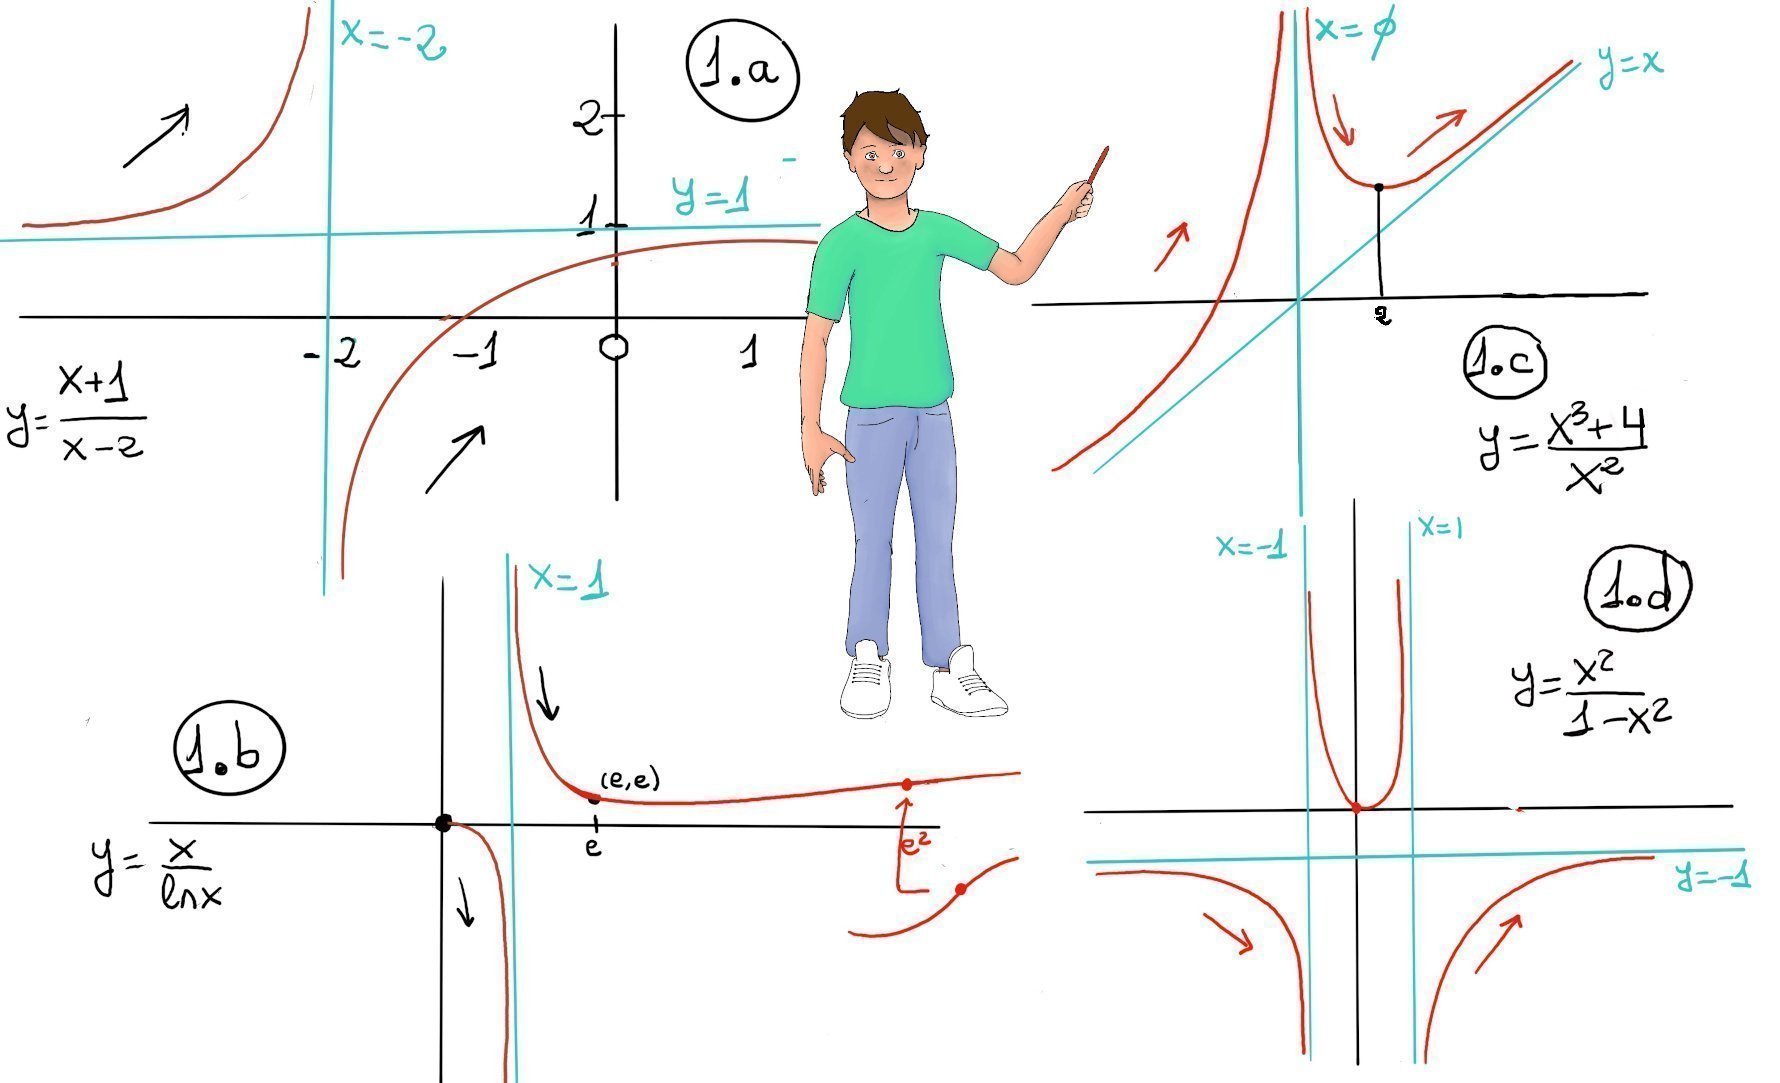
The plot is shown in Figure 1.a.
Domain and Continuity
The function involves division, so we must identify where the denominator is zero.
$x^2 = 0 \implies x = 0$
Domain: All real numbers except zero, denoted as $\mathbb{R} \setminus \{0\}$ or $(-\infty, 0) \cup (0, \infty)$. The function is not defined at $x = 0$.
Vertical Asymptotes
We evaluate the limit of the function as $x$ approaches the undefined point $x = 0$.
Because the numerator approaches a positive constant (4) and the denominator approaches zero from the positive side (since $x^2$ is always positive), the limit evaluates to positive infinity: $\lim_{x \to 0} \frac{x^3 + 4}{x^2} = \infty$
Therefore, the y-axis, $x = 0$, is a vertical asymptote.
End Behavior and Oblique (Slant) Asymptotes
As $x \to \pm\infty$, the function grows without bound:
$\lim_{x \to \infty} \frac{x^3 + 4}{x^2} = \infty$, $\lim_{x \to -\infty} \frac{x^3 + 4}{x^2} = -\infty$
Because the degree of the numerator (3) is exactly one greater than the degree of the denominator (2), the function has an oblique asymptote.
Definition: A function $f(x)$ is asymptotic to a linear line $y = mx + n$ (where $m \neq 0$) if the constants can be found using these limit definitions: $m = \lim_{x \to \pm\infty} \frac{f(x)}{x}$, $n = \lim_{x \to \pm\infty} (f(x) - mx)$.
Let’s calculate $m$ and $n$ for our function:
Finding $m$: $m = \lim_{x \to \pm\infty} \frac{\frac{x^3 + 4}{x^2}}{x} = \lim_{x \to \pm\infty} \frac{x^3 + 4}{x^3} = 1$
Finding $n$: $n = \lim_{x \to \pm\infty} \left( \frac{x^3 + 4}{x^2} - 1x \right) = \lim_{x \to \pm\infty} \frac{4}{x^2} = 0$
Conclusion: $m = 1$ and $n = 0$, the line $y = x$ is an oblique asymptote.
First Derivative (Monotonicity & Extrema)
To find where the function is increasing or decreasing, we apply the quotient rule to find $f'(x)$:
$f'(x) = \frac{(3x^2)(x^2) - (x^3 + 4)(2x)}{(x^2)^2}$
$f'(x) = \frac{3x^4 - 2x^4 - 8x}{x^4} = \frac{x^4 - 8x}{x^4}$
Factoring out an $x$ from the numerator and simplifying gives: $f'(x) = \frac{x^3 - 8}{x^3}$
Set $f'(x) = 0$ to find critical points: $x^3 - 8 = 0 \implies x = 2$
Now, test intervals around $x = 0$ (the asymptote) and $x = 2$ (the critical point):
$\star$, $x < 0$: $f'(x)$ is $\frac{\text{negative}}{\text{negative}} > 0 \implies$ function is increasing.
$\star$, $0 < x < 2$: $f'(x)$ is $\frac{\text{negative}}{\text{positive}} < 0 \implies$ function is decreasing.
$\star$, $x > 2$: $f'(x)$ is $\frac{\text{positive}}{\text{positive}} > 0 \implies$ function is increasing.
Because the function changes from decreasing to increasing at $x = 2$, this point is a local minimum. Substituting $x = 2$ back into the original equation gives $y = \frac{8+4}{4} = 3$. The local minimum is located at (2, 3).
Second Derivative (Concavity)
To verify concavity, we can quickly derive $f'(x) = 1 - 8x^{-3}$:
$f''(x) = 24x^{-4} = \frac{24}{x^4}$
Since $x^4$ is always positive for any non-zero real number, $f''(x) > 0$ everywhere on its domain. This means the graph is entirely concave upward on both sides of the vertical asymptote.
The plot is shown in Figure 1.c.

JustToThePoint Copyright © 2011 - 2026 Anawim. ALL RIGHTS RESERVED. Bilingual e-books, articles, and videos to help your child and your entire family succeed, develop a healthy lifestyle, and have a lot of fun. Social Issues, Join us.
This website uses cookies to improve your navigation experience.
By continuing, you are consenting to our
use of cookies, in accordance with our Cookies Policy and
Website Terms and Conditions of use.