
|
 |

|
|
|
|
|
|
Mathematics is not about numbers, equations, computations, or algorithms: it is about understanding, William Paul Thurston.

Definition. A function f is a rule, relationship, or correspondence that assigns to each element x in a set D, x ∈ D (called the domain) exactly one element y in a set E, y ∈ E (called the codomain or range).
The pair (x, y) is denoted as y = f(x) where: x is the independent variable (input) and y is the dependent variable (output). Often, both the domain D and codomain E are the set of real numbers ℝ or subsets of ℝ.
D is the domain, the set of all possible inputs. E is the codomain or range, the set of all possible outputs.
Key property💡: Each input has exactly one output. (No input is assigned two different outputs — this is the vertical line test!)
Examples: constant, f(x) = c, horizontal line, slope = 0; linear, f(x) = mx + b, straight line, constant slope m and y-intercept b; quadratic $f(x) = ax^2 + bx + c$, u-shaped or inverted U, opens up (a > 0) or down (a < 0), vertex at x = $\frac{-b}{2a}$, symmetry about vertical axis through vertex; polynomial, $f(x) = a_n x^n + \dots + a_0$, a smooth and continuous curve, n roots (counting multiplicity), end behaviour determined by its leading term $a_n x^n$; exponential function, $f(x) = a \cdot b^x, a \ne 0, b \gt 0$, rapid growth (b > 1) or decay (0 < b < 1); trigonometric functions, $\sin(x), \cos(x), \tan (z)$ oscillatory, periodic behavior (period 2π for sin/cos, π for tan), sin and cos are bounded between -1 and 1, but tan is unbounded; step function $f(x) = \lfloor x \rfloor$, greatest integer ≤ x, constant on intervals [n, n+1), jumps at integers, its graph is a staircase shape; absolute value f(x) = |x|, V-shaped graph, slope changes at 0.
Functions can be expressed in multiple forms, each useful in different contexts: verbal description, table of values (list of pairs), algebraic formula, graph, piecewise definition, recursive definition, parametric or integral form, and series representation.
Evaluating a function means finding or computing the output value f(x) for a given input value x. f(x) = $x^2-2x +4, f(2) = 2^2 -2\cdot 2 + 4 = 4 - 4 + 4 = 4, f(0) = 0^2 -2\cdot 0 + 4 = 4, f(1) = 1^2 -2\cdot 1 + 4 = 1 -2 +4 = 3$
The x-intercept is any point on the graph that intersects or crosses the x-axis. In other words, it is the value of x when the function (y-coordinate or y-value) is zero. The y-intercept is the point where the graph intersects or crosses the y-axis. y-coordinate of the point whose x-coordinate is 0, e.g., 2x - 3y = 6. x-intercept: set y = 0 → 2x = 6 ⇒ x=3, so (3, 0). y-intercept: set x = 0 → −3y = 6 ⇒ y = −2, so (0, −2).
When we study the graph of a function, two of the most important key features or “landmarks” are the x-intercepts and the y-intercept. They tell us where the graph crosses the coordinate axes.
Definition. The x-intercept of a graph is any point on the graph that intersects the x-axis. In other words, it is the value of x when the function (y-coordinate or y-value) is zero. Equivalently, a point of the form (x, 0) that satisfies the equation of the graph.
An x-intercept is a solution of the equation f(x) = 0. The x-coordinate of such a point is often called a root or zero of the function f.
Definition. The y-intercept of a graph is the point where the graph intersects or crosses the y-axis. y-coordinate of the point whose x-coordinate is 0. Equivalently, it is the point of the form (0, y) with x = 0 that lies on the graph.
Since a function must pass the vertical line test (for each x there is at most one y), a function can have at most one y-intercept. It may have no y-intercept (if x = 0 is not in the domain), but if it has one, it is unique.
Consider a linear function written in slope–intercept form: y = mx + b, where m is the slope and b is the y-intercept. The x-intercept is the solution to the equation 0 = mx +b, that is, x= −b/m (provided m ≠ 0), e.g., y = 2x -6, set y = 0: 0 = 2x −6 ⇒ 2x = 6 ⇒ x = 3, so the x-intercept is (3, 0); y = -2x + 5 (Figure iii), the x-intercept is x = -5/-2 = 5/2, that is, (2.5, 0).
Let the equation of a graph be y = -2x + 5. If you want to find the y-intercept, set x = 0 ⇒ y = -2(0) + 5 ⇒ y = 5. Therefore, the y-intercept is (0, 5) (Figure iii).
A linear function is a function of the form y = mx + b, where m is the slope of the line, b is the y-intercept, and $\frac{-b}{m}$ is the x-intercept (if m ≠ 0).
Sometimes lines are given in standard form: Ax + By = C. Example: 2x -4y = 8. Its alternate form is 4y = 2x -8 ↭ $y = \frac{2x}{4}-\frac{8}{4} ↭ y = \frac{x}{2}-2$, So the y-intercept is (0, −2) and, $\frac{-b}{m} = \frac{2}{\frac{1}{2}} = 4$, so the x-intercept is (4, 0).
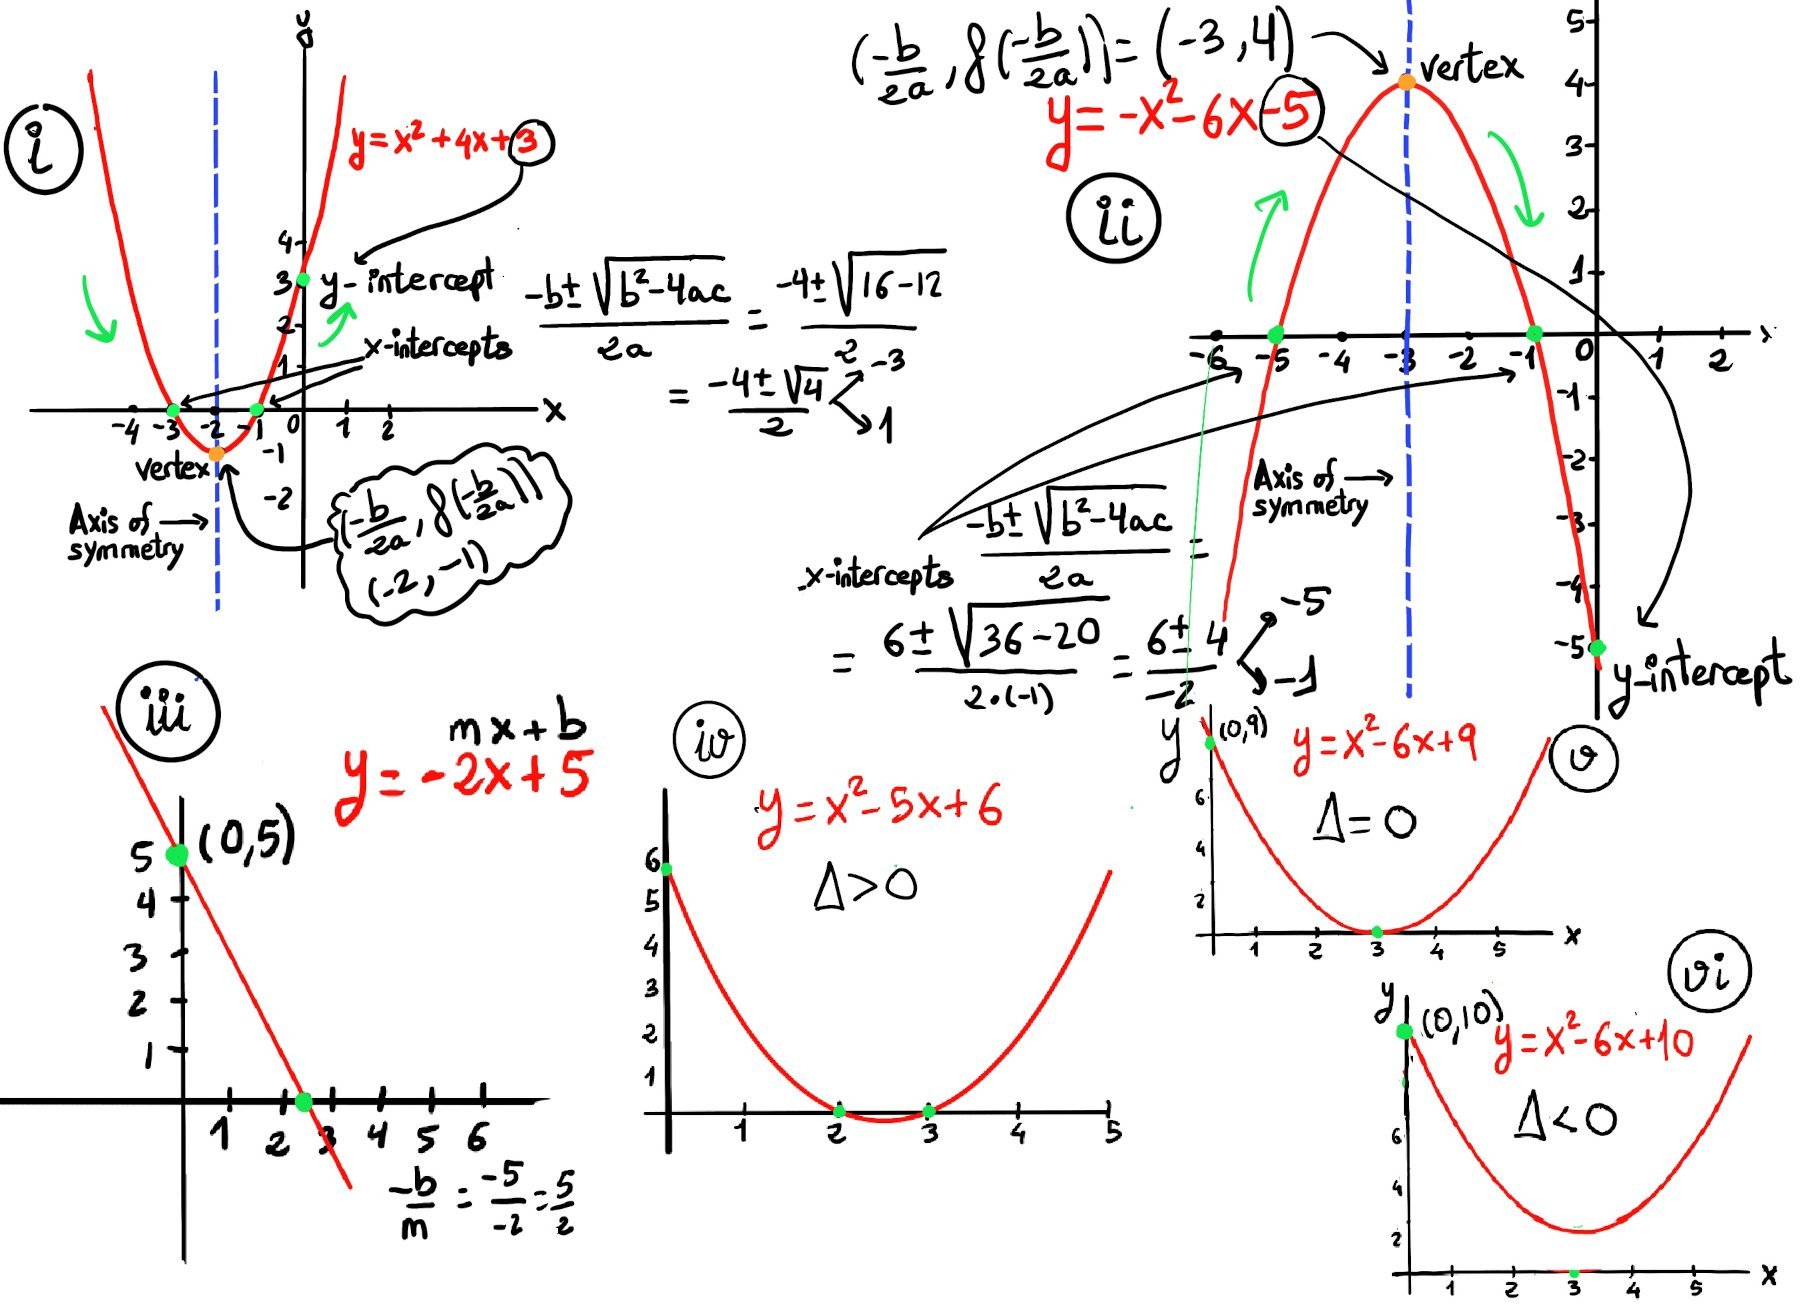
For a quadratic function $y = ax^2 +bx +c, a \ne 0$, its x-intercepts are the solutions of the quadratic equation $y = ax^2 +bx +c = 0$. We can find these using the quadratic formula: x = $\frac{-b±\sqrt{b^2-4ac}}{2a}$. The discriminant (Δ = b2 -4ac) can be used to calculate the number of x-intercepts and the type of solutions or x-intercepts of the quadratic equation.
Besides, for a quadratic equation written in standard form y = ax2 +bx +c , the y-intercept is (0, c). The graph of a quadratic function ax2 + bx + c is a parabola. It has an extreme point, called the vertex, where the curve changes direction.
If the parabola opens upwards (a > 0), the vertex represents the lowest point on the curve and its y-coordinate is the minimum value of the quadratic function. If the parabola opens downwards (a < 0), the vertex represents the highest point on the curve, and its y-coordinate is the maximum value of the quadratic function. In either case, the vertex is a turning point on the graph. The graph is also symmetric with a vertical line drawn through the vertex, called the axis of symmetry: $x = \frac{-b}{2a}$, So, the graph of the function is increasing on one side of the axis and decreasing on the other side.
Let’s find the x- and y-intersect of -2x + 4y = 8. To find the x-intercept, set y = 0 ⇒ -2x = 8 ⇒ x = $\frac{8}{-2}=-4$, that is, the x-intersect is (-4, 0). To find the y-intercept, set x = 0 ⇒ 4y = 8 ⇒ y = 2, so the y-intersect is (0, 2), Figure 1.
A completely similar example, 5x + 2y = 10. To find the x-intercept, set y = 0 ⇒ 5x = 10 ⇒ x = $\frac{10}{5}=2$, that is, the x-intercept is (2, 0). To find the y-intercept, set x = 0 ⇒ 2y = 10 ⇒ y = 5, so the y-intercept is (0, 5).
Not all graphs necessarily have both intercepts: the horizontal line y = 3 has an y-intercept at (0, 3) and no x-intercept (it never crosses the x-axis), but the vertical line x = 1 has a x-intercept at the point (1, 0) and no y-intercept (Figure 2 and 3 respectively).
Vertical lines like x = 1 are not functions; they fail the vertical line test because one input x = 1 has infinitely many possible y-values.
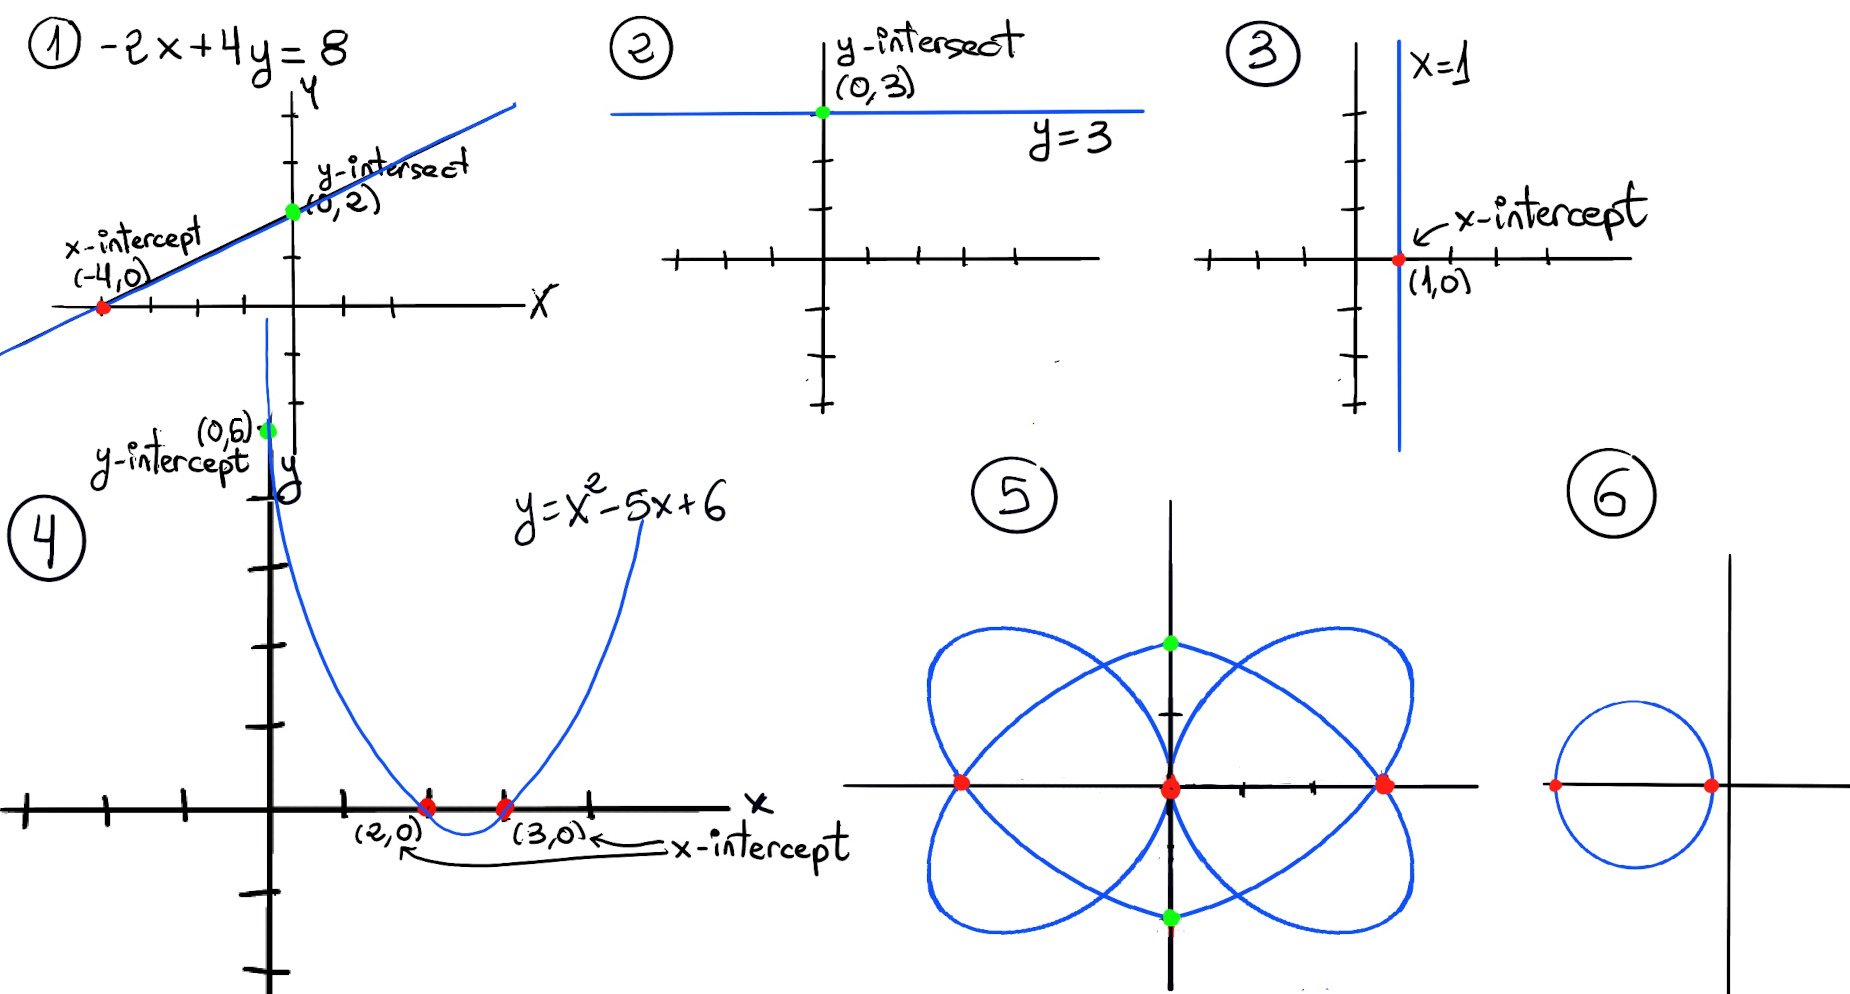
The graph of the quadratic function y = x2 -5x + 6 intersects the x-axis in two places, namely (2, 0) and (3, 0). Its only y-intercept is (0, 6) -Figure 4-.
Figure 5 and 6 illustrate that even though those graphs do not determine functions (they fail to pass the vertical test), they still have x- and y-intercepts (the circle do not have y-intercepts).
The x-intercepts are represented by red circles ((-3, 0), (0, 0), (0, 3) -Figure 5-, (-5, 0), (-1, 0) -Figure 6-) and the y-intercepts by green circles ((0, 2) and (0, -2) -Figure 5-).
If the graph passes through the origin (0,0), it has both an x-intercept and a y-intercept at the origin.
The reciprocal function $y = \frac{1}{x}$ has no intercepts because it is undefined at x = 0 (so it never crosses the y-axis) and $\frac{1}{x} = 0$ has no solution (so the graph never crosses or touches the x-axis). Asymptotes: x = 0 and y = 0.
The graph of the sine function, y = sin(x), has infinitely many x-intercepts at $x = \dots, -2\pi, -\pi, 0, \pi, 2\pi, 3\pi, \dots$ (i.e., $x = k\pi$, $k \in \mathbb{Z}$).
Exponential functions $y = a^x$ (with $a > 0$, $a \neq 1$) have no x-intercepts (exponential functions never cross the x-axis) but exactly one y-intercept at $(0,1)$ (Substituting x = 0: $y=a^0=1$). So the graph always passes through the point (0, 1).
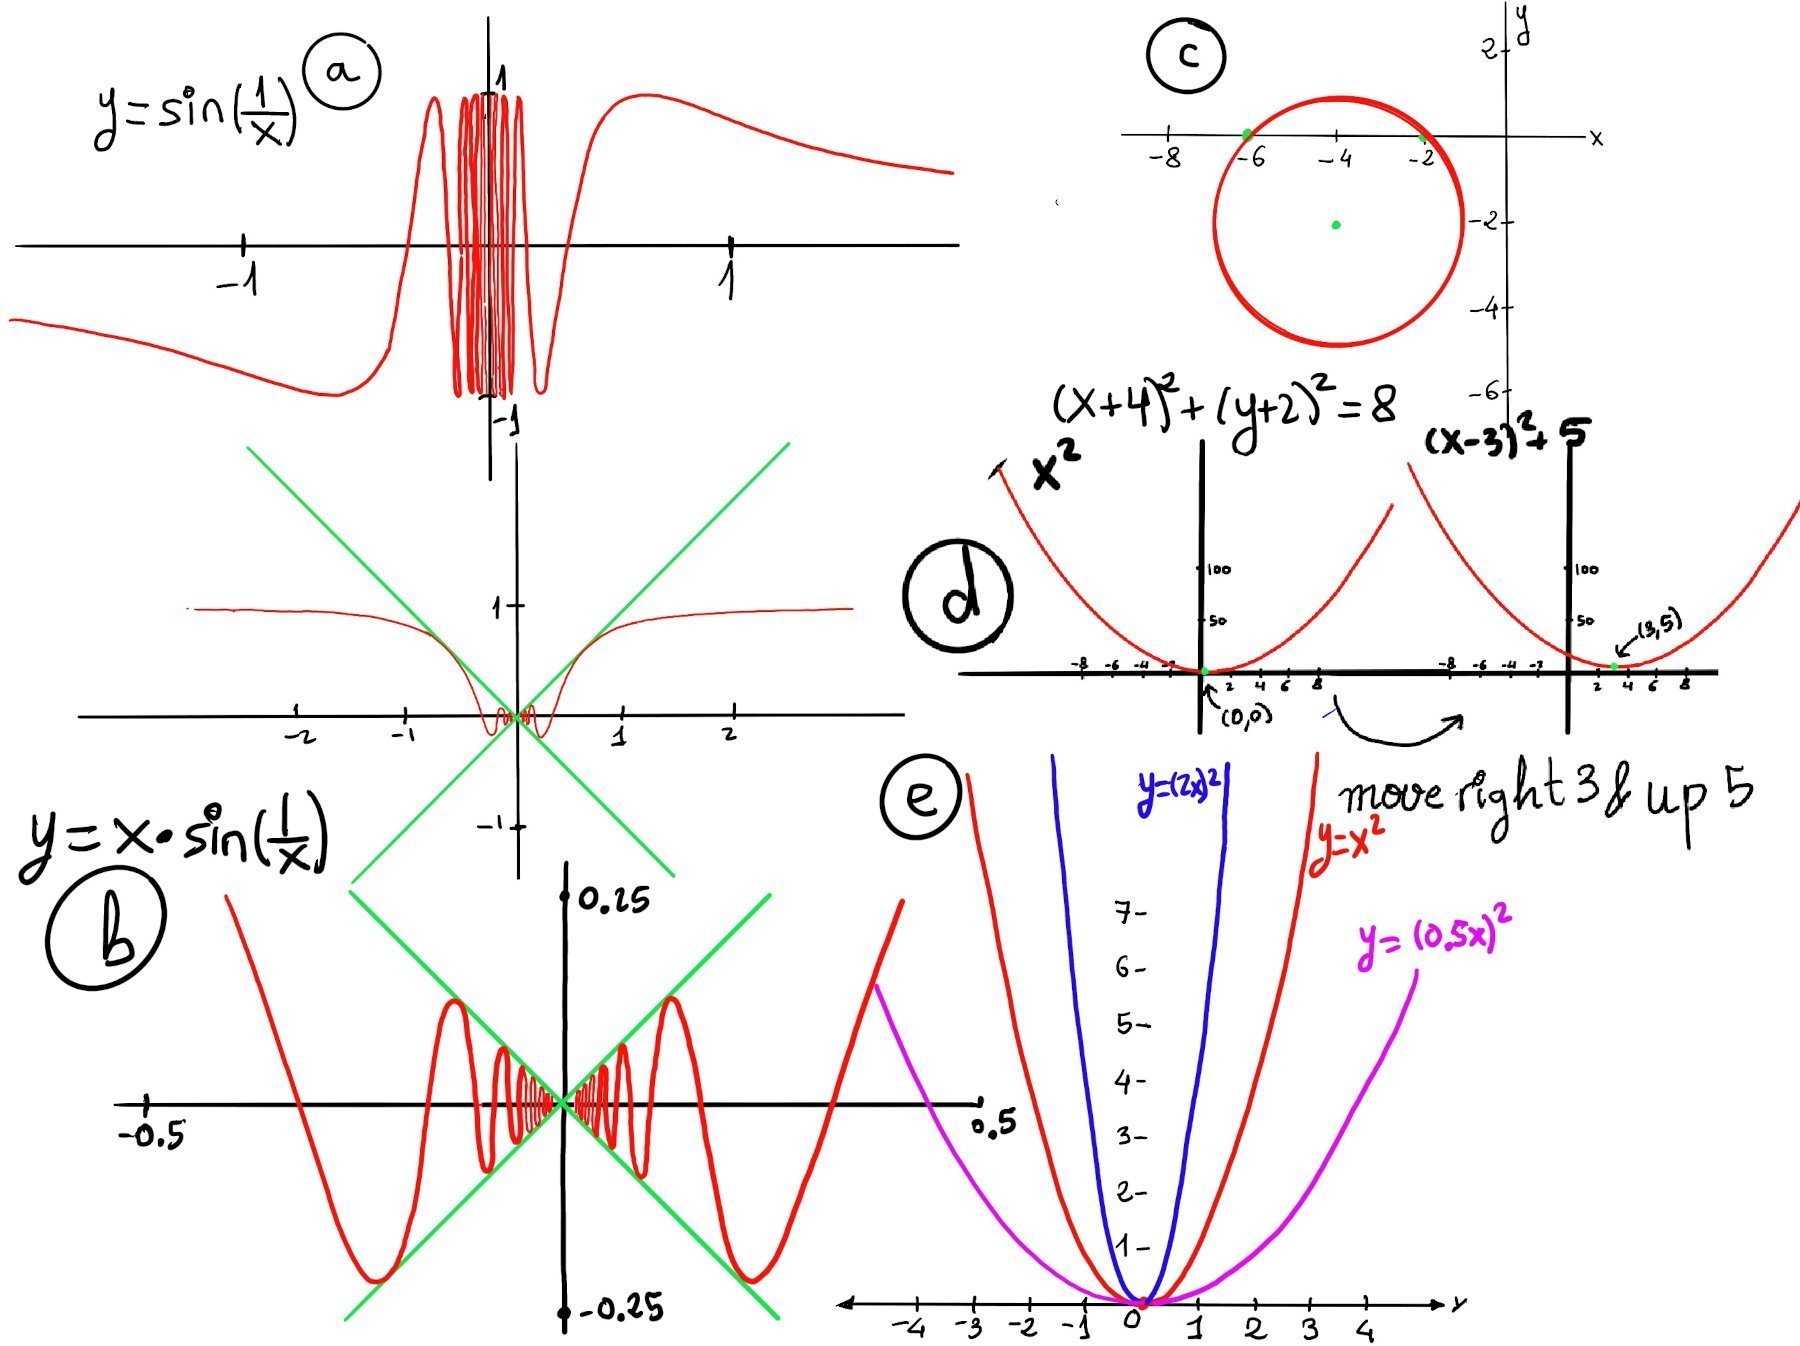
Let’s find the x- and y-intersect of (x + 4)2 + (y + 2)2 = 8 (Figure c).
x-intercepts; set $y = 0$ and solve for x:
$$ \begin{align*} (x + 4)^2 + (0 + 2)^2 &= 8 \\ (x + 4)^2 + 4 &= 8 \\ (x + 4)^2 &= 4 \\ x + 4 &= \pm 2 \\ x &= -4 \pm 2 \end{align*} $$The x-intercepts are: $(-6, 0)$ and $(-2, 0)$
y-intercepts; set $x = 0$ and solve for y:
$$ \begin{align*} (0 + 4)^2 + (y + 2)^2 &= 8 \\ 16 + (y + 2)^2 &= 8 \\ (y + 2)^2 &= -8 \quad (\text{impossible for real } y) \end{align*} $$$y^2 + 4y + 12 = 0$. Discriminant $b^2 - 4ac = 16 - 64 = -48 < 0$. No real y-intercepts.
(x -a)2 + (y -b)2 = r2 is the standard equation of a circle, the center is (a, b) and the radius is r. In our case, the center is (-4, -2) and the radius is $\sqrt{8} = 2\sqrt{2} ≈ 2.83$.
So the circle crosses the x-axis twice (at x = -6 and x = -2) and extends a little above the x-axis (highest point ≈ 0.83). It never reaches the y-axis because the distance from the center to the y-axis is 4 units, while the radius is only ≈ 2.83 < 4 .

JustToThePoint Copyright © 2011 - 2026 Anawim. ALL RIGHTS RESERVED. Bilingual e-books, articles, and videos to help your child and your entire family succeed, develop a healthy lifestyle, and have a lot of fun. Social Issues, Join us.
This website uses cookies to improve your navigation experience.
By continuing, you are consenting to our
use of cookies, in accordance with our Cookies Policy and
Website Terms and Conditions of use.