
|
 |

|
|
|
|
|
|
The problem is not the problem. The problem is your attitude about the problem, Captain Jack Sparrow

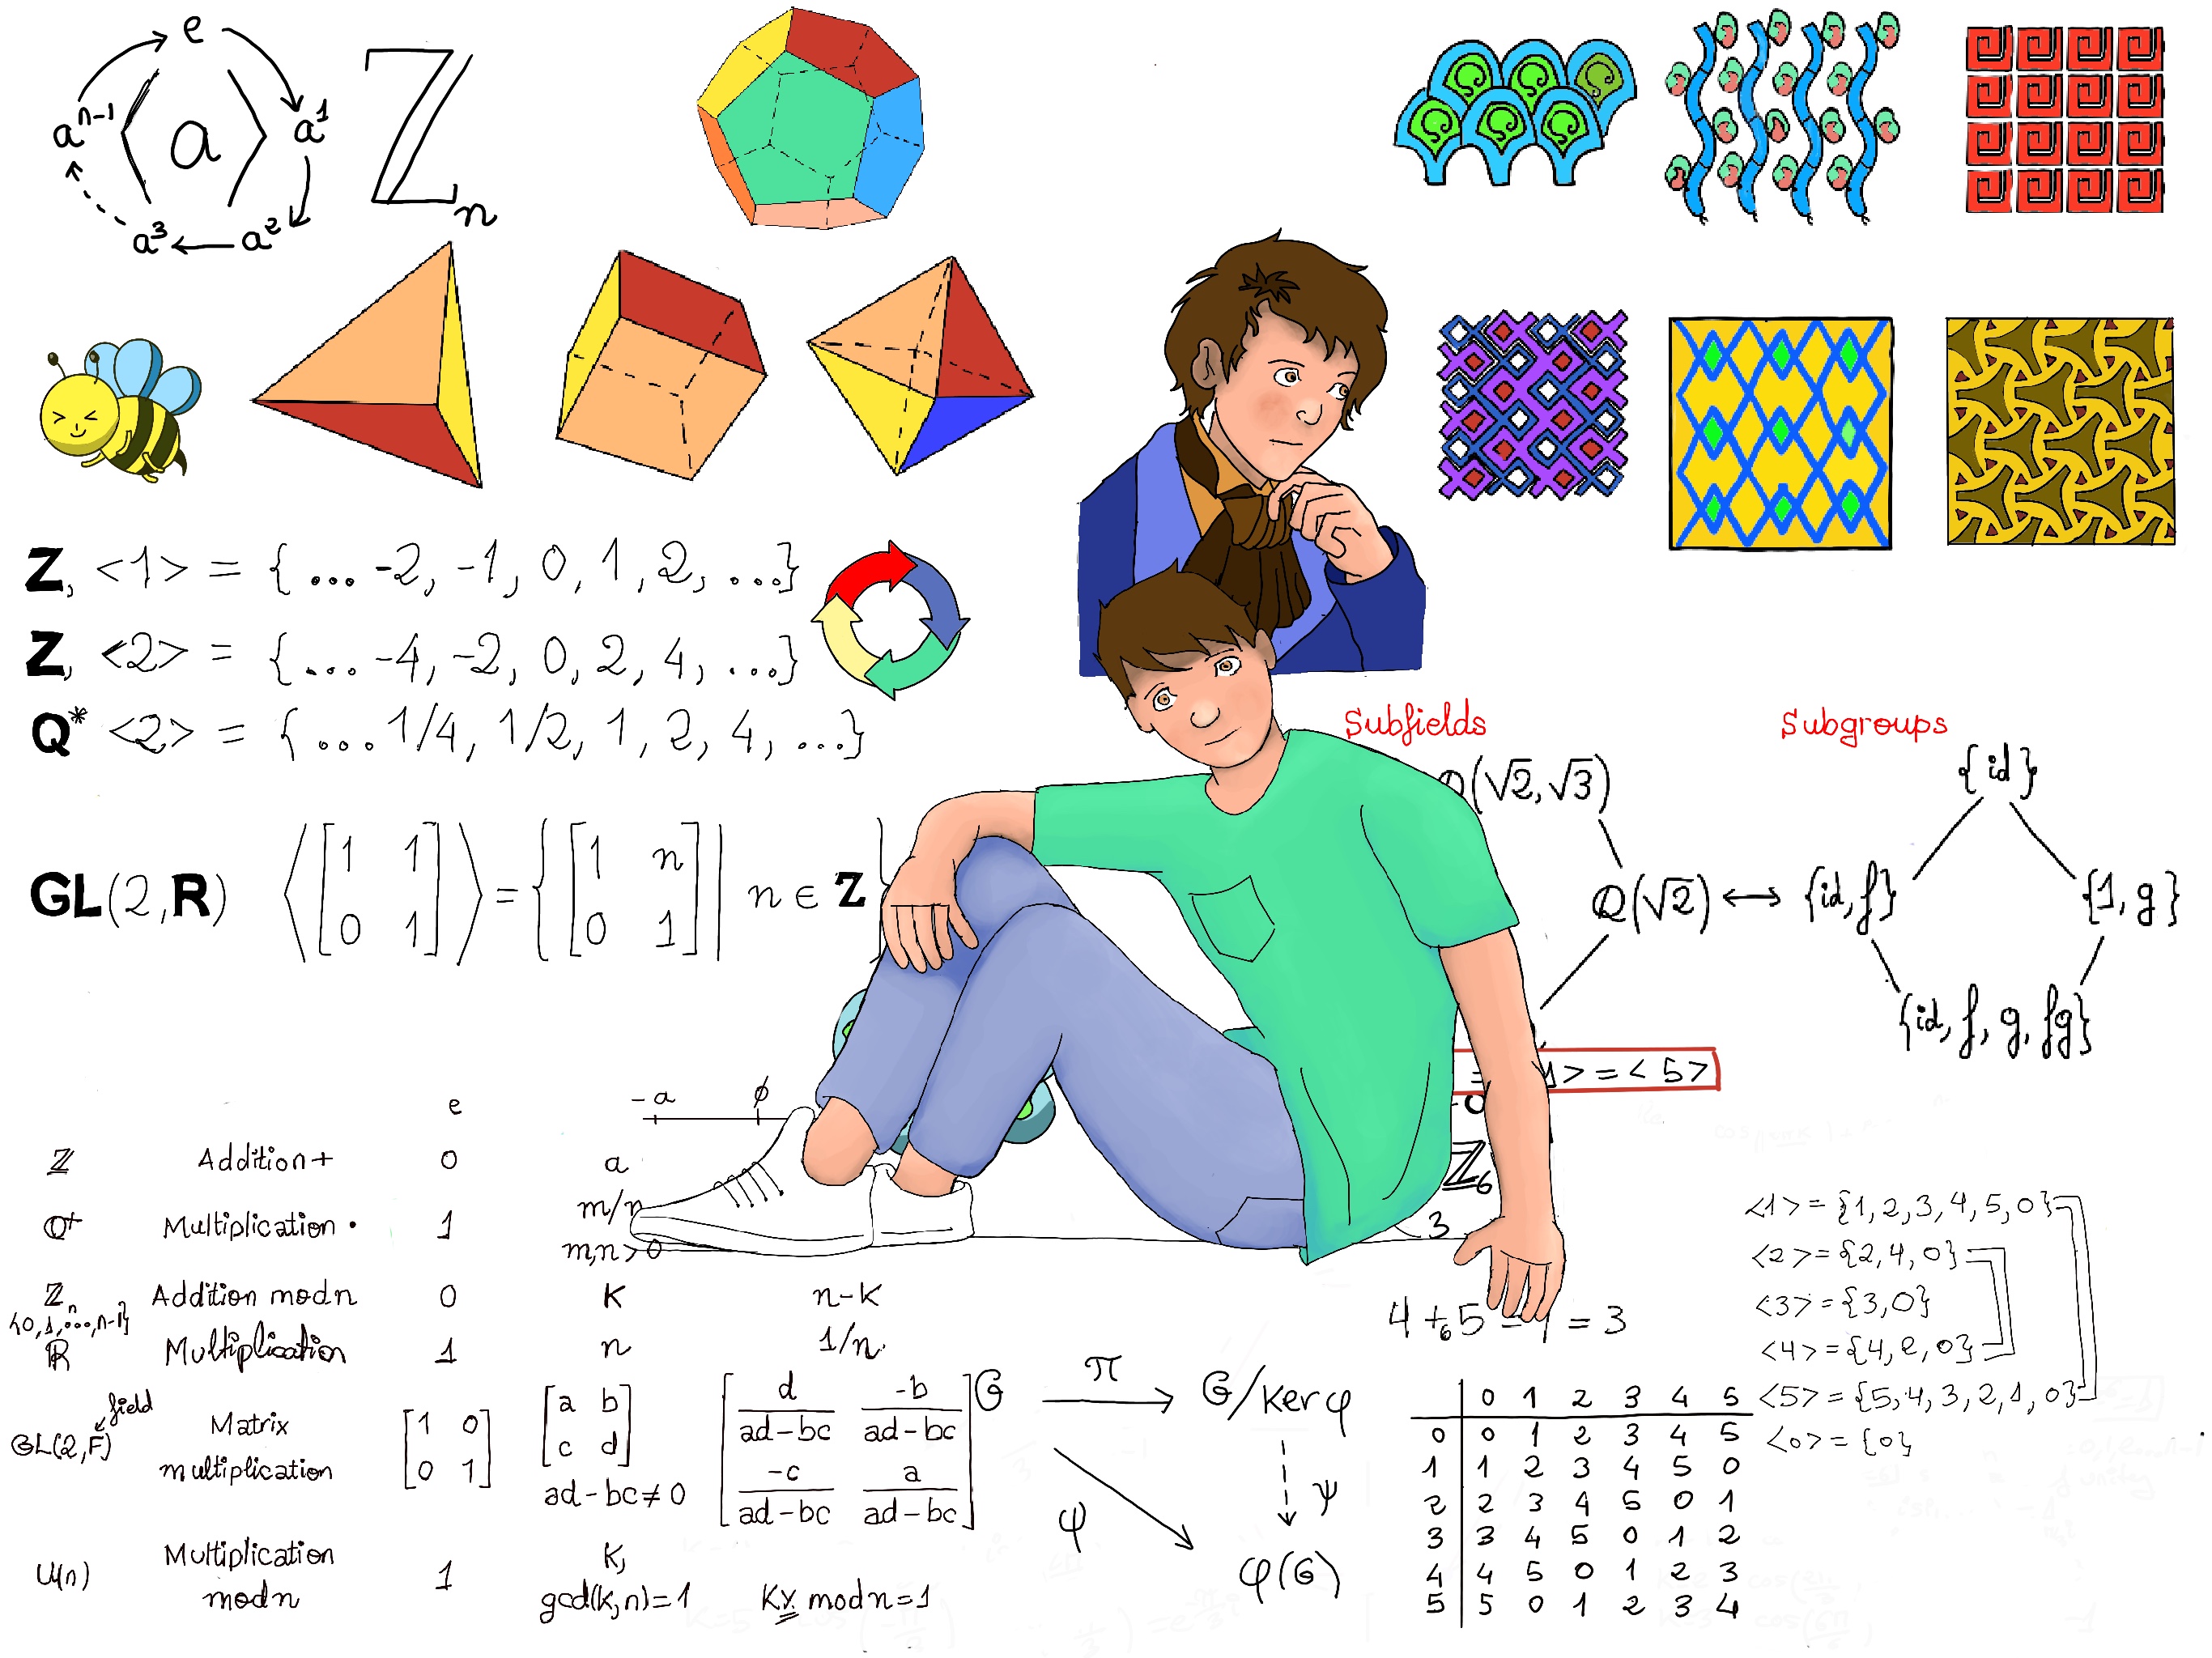
Definition. In mathematics, a function f is a rule, relationship, or correspondence that assigns to each element of one set (the domain, often denoted D) exactly one element of a second set (the range or codomain, denoted E). In other words, a function pairs every permissible input with exactly one output.
We denote this relationship by writing f: D → E, and for each input x ∈ D, the corresponding output is y = f(x). The ordered pair (x, f(x)) represents a point on the graph of the function. In many contexts —especially in calculus and elementary analysis— the domain and codomain are both taken to be the set of real numbers, ℝ.
You can think of a function as a sort of machine, vending machine, or a black box that takes an input and produces an output. Every time you feed the machine the same input, you get the same output. If an input is not accepted by the machine (not in the domain), the function is not defined for that input. Similarly, if the machine ever gave two different results for the same input, it would be broken – likewise, a mathematical function cannot assign two different outputs to one input, e.g., $f(x) = \pm\sqrt{x}$ fails to be a function because an input like x = 4 could produce two outputs (2 or -2). A valid function must produce a single, unambiguous output for each input.
Each input yields one and only one output,although different inputs are allowed to yield the same output, e.g., $f(x) = x^2, f(2) = f(-2) = 4.$
For a rule to define a genuine function, it must be well-defined. If a = b in the domain, then f(a) = f(b). Counterexample: Consider the proposed rule f: ℚ → ℚ, given by f(p/q) = -p. This is not a function because rational numbers have multiple representations f(1⁄2)=-1≠-2=f(2⁄4), but 1⁄2 = 2⁄4. Since the output depends on the representation rather than the value of the input, the rule fails to assign a unique output to each input —and thus is not well-defined.
Definition. The domain of a function is the set of all inputs for which the function is defined. Equivalently, it is the set of all possible “x” values one can plug into the function and actually get an output that “makes sense” as a real number. If a function formula is given and no domain is stated explicitly, it is usually assumed that the domain consists of all real numbers for which the expression can be evaluated to yield a real number.
This means we exclude values that would cause problems like division by zero, taking an even root of a negative number, logarithm of a non-positive number, etc.
Examples:
Definition. The range of a function (also sometimes called the image) is the set of all outputs that the function can produce. In other words, it is the complete set of all possible “y” or f(x) values that actually occur or come out for some x in the domain.
Examples:
A function can be expressed or represented in many equivalent yet distinct forms, each useful in different contexts. Below are the most common representations.
| x | 1 | 2 | 3 | 4 | 5 | 6 | 7 |
|---|---|---|---|---|---|---|---|
| f(x) | 2 | 4 | 6 | 8 | 10 | 12 | 14 |
Unless otherwise specified, the domain is the largest set of real numbers for which the expression is defined and yields a real value, e.g., f(x) = x3 + 2x2 + 4, Domain(f) = ℝ; g(x) = $\sqrt{x-2}$, Domain(g) = ℝ - {x ≥ 2} = [2, +∞); h(x) = $\frac{2x+3}{x^2-x}+4,$ Domain(h) = (-∞, 0) ∪ (0, 1) ∪ (1, ∞). r(x) = $\frac{\sqrt{x}}{x^2 - x},$ Domain(r) = (0, 1) ∪ (1, ∞) = {x ∈ ℝ: 0 < x < 1 or x > 1}.
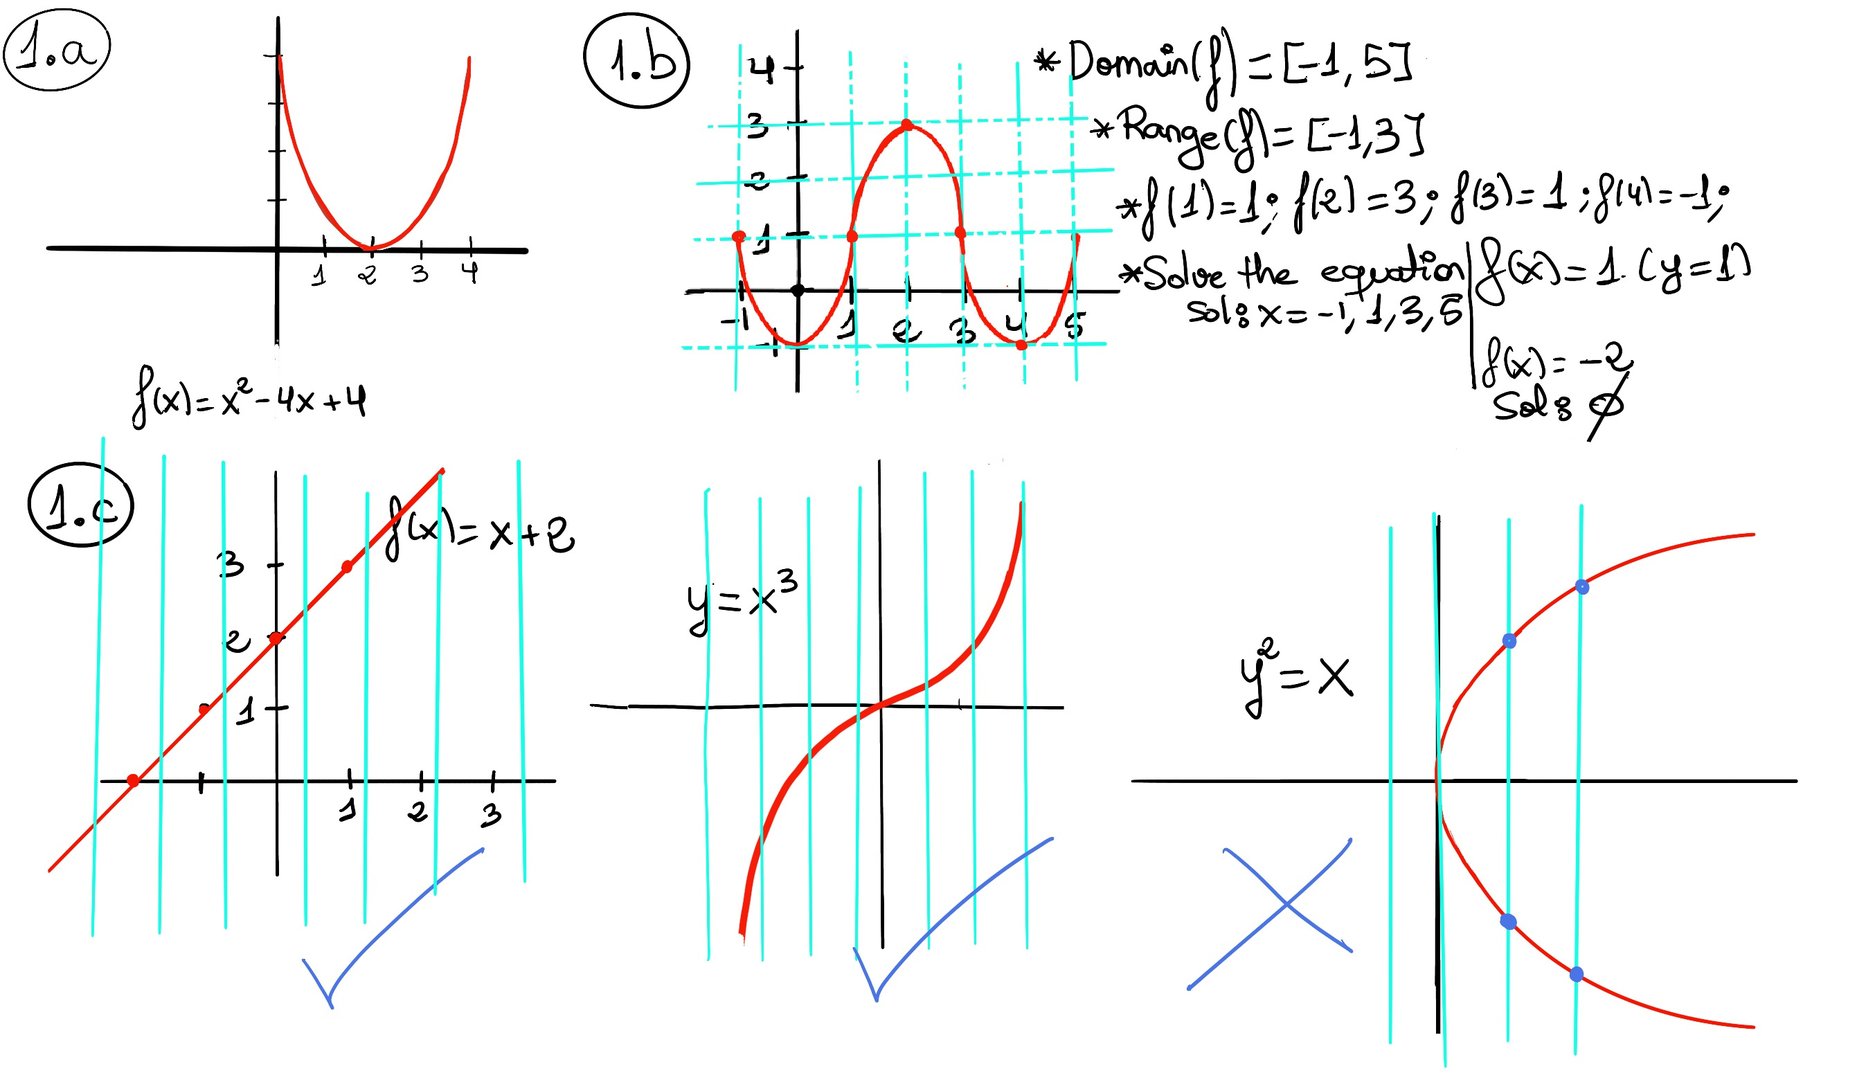
For example, the function $f(x)=x^2−4x+4$ can be graphed as a parabola opening upward, has it vertex at (2, 0), touches the x-axis (a single root) at x = 2, and is symmetrical around the vertical line x = 2; x + 3 can be plotted as a straight line with slope 1 (meaning it rises one unit vertically for every one unit it moves horizontally) and intersects the y-axis at the point (0, 3); $x^3$ is a s-shape curve that passes through the origin, with rapid growth as |x| increases, and is symmetric about the origin; the absolute value |x| is a distinctive v-shape that opens upward with its minimum point located at the origin. $2^x$ is an exponential growth function. Its curve stays entirely positive and increases rapidly as 𝑥 increases; sin(x) is a smooth, oscillating wave that ranges between a maximum of 1 and a minimum of -1, and it repeats its pattern every 2𝜋 radians.
Since the graph provides insight into the function’s behavior (increasing/decreasing, maxima/minima, etc.) that might be less obvious from the formula alone, graphical representations are often more intuitive.
$f(x) = \begin{cases} x, &x ≥ 0 \\\\ -x, &x < 0 \end{cases}$
which means f(x) = x if x is nonnegative and f(x) = −x if x is negative (the absolute value flips the sign to make it positive). This yields the familiar v-shaped graph opening upward of the absolute value, since f(x) = ∣x∣. The absolute value |x| of a real number x is the non-negative value (or magnitude) of x regardless of sign. It is the distance of the number x from zero on the real line.
As another example, consider a function defined piecewise as
$f(x) = \begin{cases} x + 1, &x > 0 \\\\ -2x + 2, &x < 0 \end{cases}$
Here the formula changes at x = 0: for positive inputs it follows x + 1, and for negative inputs it follows −2x +2. It is undefined at x = 0, unless a value is explicitly assigned.
Some examples are:
Sometimes, however, a parametric curve does correspond to a function when the relation can be rearranged to an explicit y = f(x) form, e.g., x = 4t, y = 2t2 for -1 ≤ t ≤ 1. It is often possible to convert a parametric representation of a function into the more usual form by combining the two expressions to eliminate the parameter, y = 2t2 =[t = x⁄4] $2(\frac{x}{4})^2=\frac{2x^2}{16}=\frac{x^2}{8}$ (a parabola opening upward, Figure 2.a).
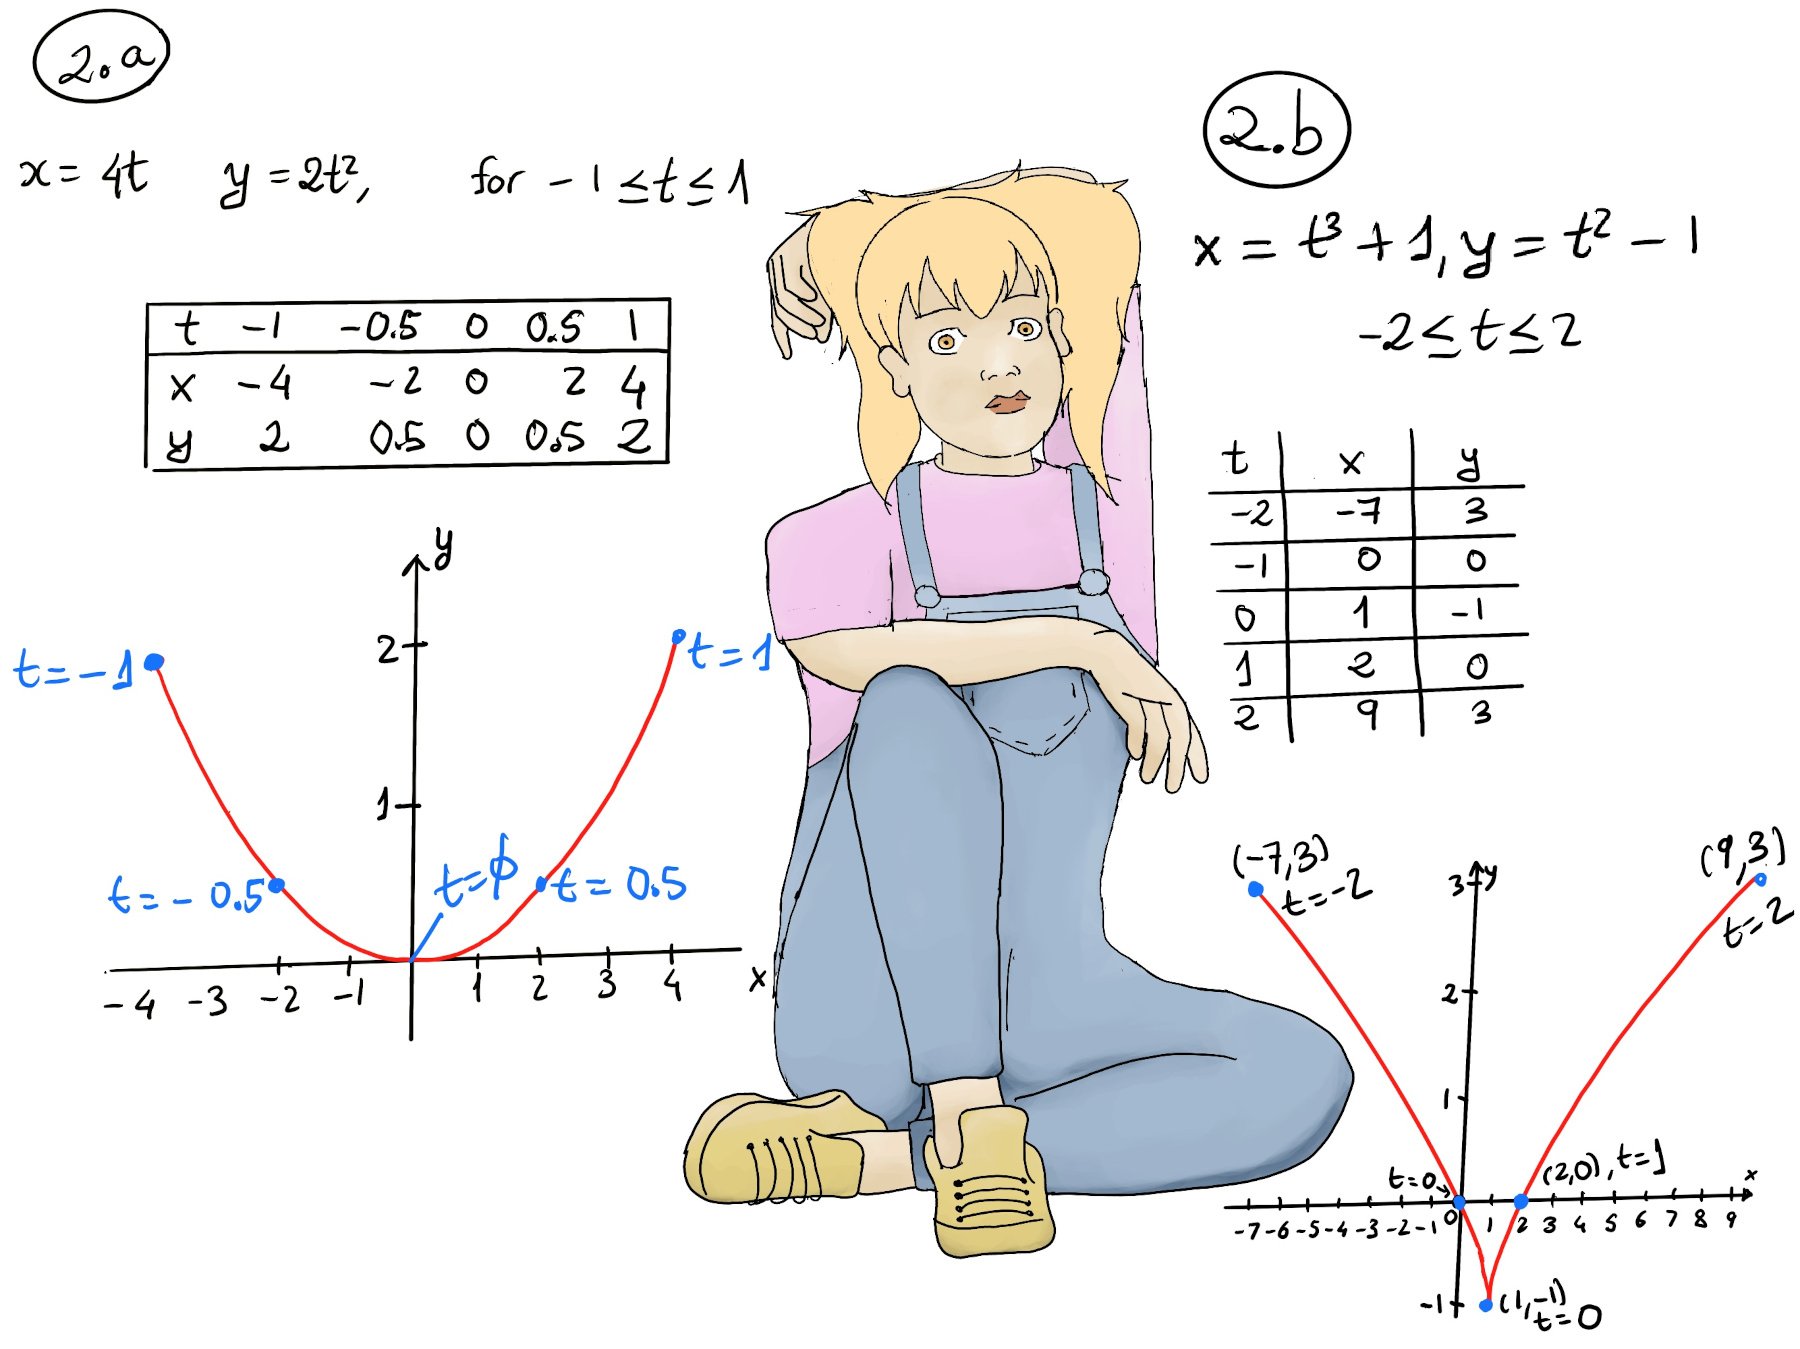
As another example, consider the parametric equations x = t3 + 1, y = t2 −1, −2 ≤ t ≤ 2 (Figure 2.b.). We can also eliminate the parameter t, y = t2 −1 =[t = (x-1)1/3] = $(x-1)^{2/3}-1.$
Integral representation. We can also define a function by an integral formula. This means the value of the function at a certain point is given as an integral (area under a curve) from one bound to the point of interest, e.g., the error function $erf: \mathbb{C} \to \mathbb{C}, erf(z) = \frac{2}{\sqrt{\pi}}\int_{0}^{z} e^{-t^2}dt.$ Another example is n! = $\int_{0}^{∞} t^ne^{-t}dt$, a specific case of the gamma function, $\Gamma (z)=\int _0^{\infty} t^{z-1}e^{-t}dt, \text{ for } ℜ(z) \gt 0$. By substituting z = n + 1, the definition becomes, $\Gamma (n+1)=\int _0^{\infty} t^{(n+1)-1}e^{-t}dt = \int_{0}^{∞} t^ne^{-t}dt$. So factorials are just a special case of the Gamma function at integer arguments, $\Gamma (n+1)= n!$
Series representation. Many functions can be represented as an infinite sum of terms, known as a series. For example, the exponential function can be written as a power series $e^x = \sum_{n=0}^\infty \frac{x^n}{n!}$. Similarly, the trigonometric functions have well-known series: cos(x) = $\sum_{n=0}^\infty \frac{(-1)^nx^{2n}}{(2n)!}$, sin(x) = $\sum_{n=0}^\infty \frac{(-1)^nx^{2n+1}}{(2n+1)!}$.
In this context, the function is defined as the limit of its partial sums: if $S_N(x) = \sum_{n=0}^{N} a_n(x)$, then $f(x) = \lim_{N \to \infty} S_N(x),$ provided the limit exists.
Evaluating a function means finding or computing the output value f(x) for a given input value x. If we have a function f and we want to find f(a) for some specific input a, we substitute x = a into the rule/formula for f(x) and simplify. Examples:
f(x) = $x^2-2x +4, f(2) = 2^2 -2\cdot 2 + 4 = 4 - 4 + 4 = 4, f(0) = 0^2 -2\cdot 0 + 4 = 4, f(1) = 1^2 -2\cdot 1 + 4 = 1 -2 +4 = 3$. f(x) = $\frac{2x+3}{x^2-x}+4$, and we want to find f(2), we’d plug in x = 2: f(2) = $\frac{2(2)+3}{2^2-2}+4 = \frac{7}{2}+4 = \frac{7}{2}+\frac{8}{2}=\frac{15}{2}$. $f(x)=\frac{1}{x}, f(0)$ is not defined.
If a function is defined by a table or list of pairs, evaluation is just reading off the corresponding output.
| x | 1 | 2 | 3 | 4 | 5 | 6 | 7 |
|---|---|---|---|---|---|---|---|
| f(x) | 2 | 4 | 6 | 8 | 10 | 12 | 14 |
How can we tell from a graph whether a given curve represents a function? The vertical line test is a graphical method of determining whether a curve represents the graph of a function or not by visually examining the number of intersections of the curve with vertical lines. A curve in the xy-plane is the graph of a function if and only if no vertical line intersects the curve more than once.
Why does this work? A vertical line x = a represents a fixed input value a. Where that line meets the graph, the y-coordinates of those intersection points are the outputs corresponding to x = a. If the line hits the graph twice (say at points $(a, y_1)$ and $(a, y_2)$ with $y_1 \ne y_2$), that means the relation had two outputs for the single input x = a. Such a relation is not a function.
Example: The graphs of f(x) = x + 2, y = x3 pass the vertical line test. Any vertical line will intersect their graphs (a straight line with slope 1 and intercept 2 and a cubic curve, respectively) exactly once. However, y2 = x does not pass the vertical line test, so this is not a function. This equation can be rewritten as y = $±\sqrt{x}$ which means for a given x (say x = 4) there are two possible y values (2 or -2). If you draw its graph, it is a parabola opening to the right, and any vertical line to the right of the y-axis will cut the curve in two places (one above the x-axis, one below) -Figure 1.c-. A circle, such as defined by x2 + y2 = 9 is also not the graph of a single function y = f(x). A vertical line through most x-values between -3 and 3 will hit the circle at two points (an upper and a lower point), e.g., x = 0 corresponds to two points on the circle (0, 3) and (0, -3).

JustToThePoint Copyright © 2011 - 2026 Anawim. ALL RIGHTS RESERVED. Bilingual e-books, articles, and videos to help your child and your entire family succeed, develop a healthy lifestyle, and have a lot of fun. Social Issues, Join us.
This website uses cookies to improve your navigation experience.
By continuing, you are consenting to our
use of cookies, in accordance with our Cookies Policy and
Website Terms and Conditions of use.